Answered step by step
Verified Expert Solution
Question
1 Approved Answer
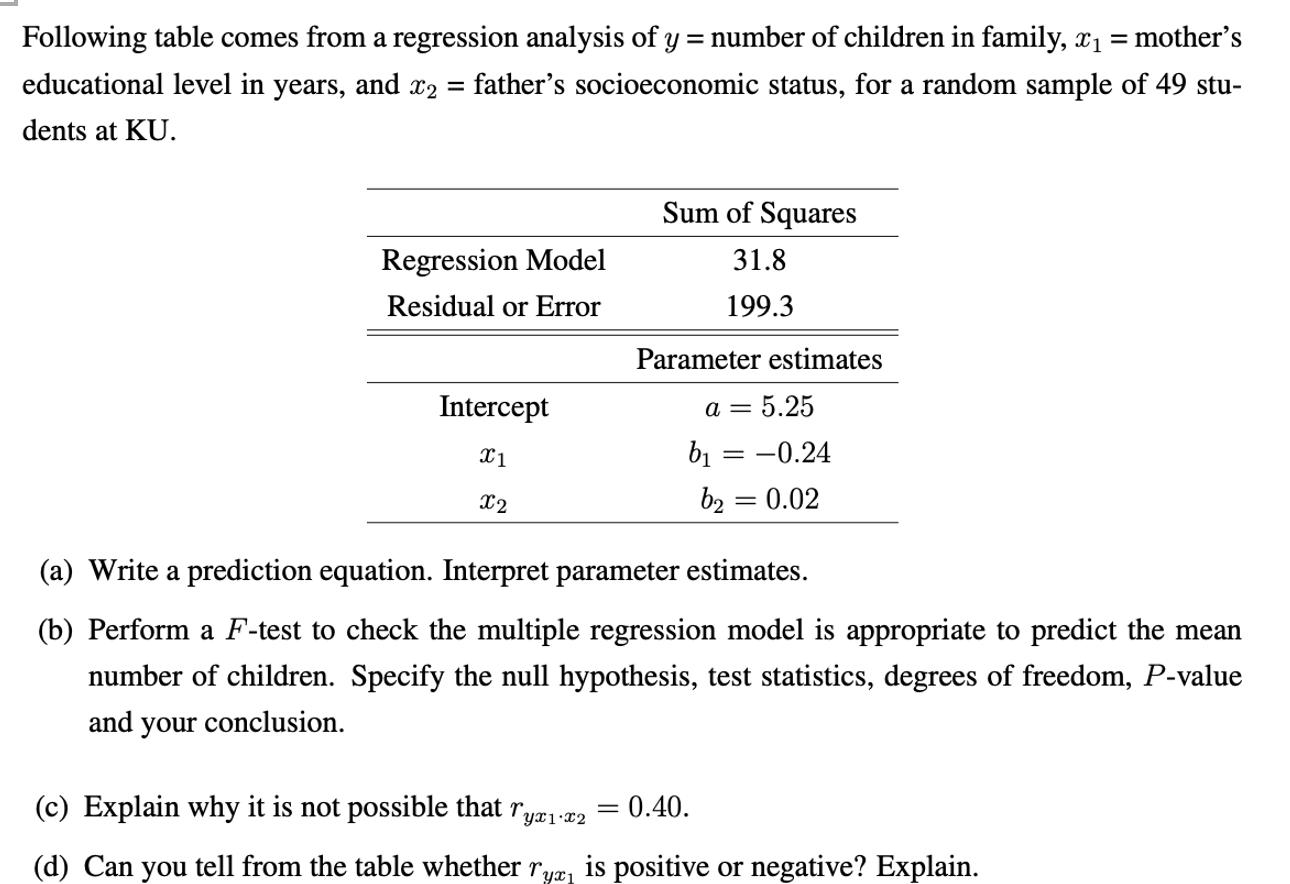
Following table comes from a regression analysis of y = number of children in family, x = mother's educational level in years, and x2

Following table comes from a regression analysis of y = number of children in family, x = mother's educational level in years, and x2 father's socioeconomic status, for a random sample of 49 stu- = dents at KU. Regression Model Residual or Error Sum of Squares 31.8 199.3 Parameter estimates Intercept a = 5.25 b = -0.24 b = 0.02 X1 X2 (a) Write a prediction equation. Interpret parameter estimates. (b) Perform a F-test to check the multiple regression model is appropriate to predict the mean number of children. Specify the null hypothesis, test statistics, degrees of freedom, P-value and your conclusion. (c) Explain why it is not possible that r yx1.x2 = 0.40. (d) Can you tell from the table whether y is positive or negative? Explain.
Step by Step Solution
There are 3 Steps involved in it
Step: 1
a Write a prediction equation Interpret parameter estimates To write the prediction equation based on the given parameter estimates we simply put the parameter estimates into the general formula of a ...
Get Instant Access to Expert-Tailored Solutions
See step-by-step solutions with expert insights and AI powered tools for academic success
Step: 2

Step: 3

Ace Your Homework with AI
Get the answers you need in no time with our AI-driven, step-by-step assistance
Get Started


