

Answered step by step
Verified Expert Solution
Question
1 Approved Answer
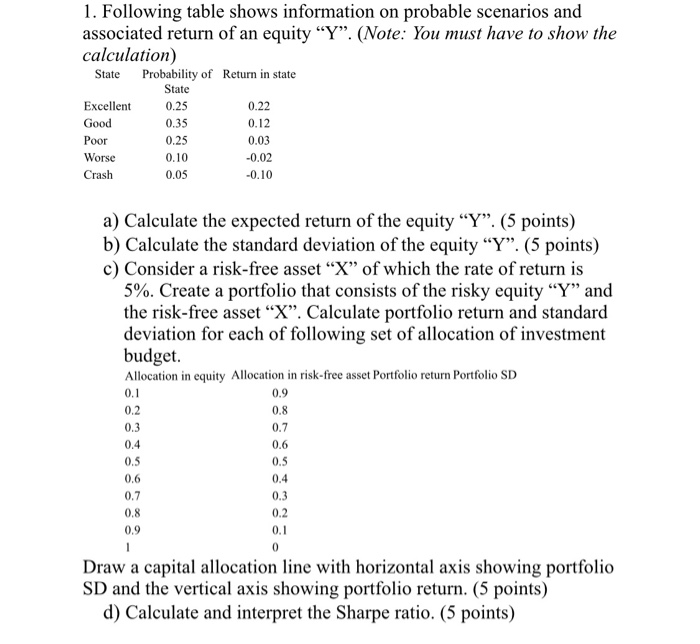
Following table shows information on probable scenarios and associated return of an equity Y. (Note: You must have to show the calculation) 1. Following table
Following table shows information on probable scenarios and associated return of an equity Y. (Note: You must have to show the calculation)
Step by Step Solution
There are 3 Steps involved in it
Step: 1

Get Instant Access to Expert-Tailored Solutions
See step-by-step solutions with expert insights and AI powered tools for academic success
Step: 2

Step: 3
Ace Your Homework with AI
Get the answers you need in no time with our AI-driven, step-by-step assistance
Get Started
Finance A Quantitative Introduction Volume 2
Authors: Piotr Staszkiewicz, Lucia Staszkiewicz
1st Edition
0128027975, 978-0128027974