Answered step by step
Verified Expert Solution
Question
1 Approved Answer
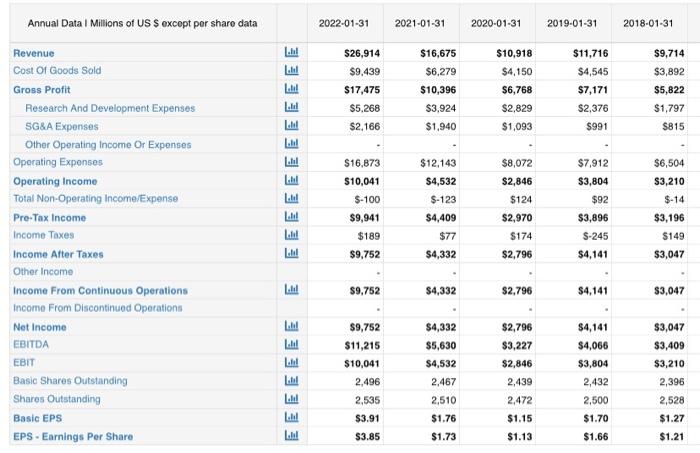
For 2018 till 2020 pleaseee! Annual Data 1 Millions of US $ excopt per sharo data 2022-01-31 2021-01-31 2020-01-31 2019-01-31 2018-01-31 EE $26,914 $9.439 $16,675
For 2018 till 2020 pleaseee! 

Annual Data 1 Millions of US $ excopt per sharo data 2022-01-31 2021-01-31 2020-01-31 2019-01-31 2018-01-31 EE $26,914 $9.439 $16,675 $6,279 $10,396 $3.924 $1.940 $17,475 $10,918 $4,150 $6,768 $2,829 $1,093 $11,716 $4,545 $7,171 $2,376 $991 $9,714 $3,892 $5,822 $1,797 $5.268 $2.166 S815 Revenue Cost Of Goods Sold Gross Profit Research And Development Expenses SG&A Expenses Other Operating Income Or Expenses Operating Expenses Operating Income Total Non-Operating Income/Expense Pre-Tax Income EEEEE $16,873 $8,072 $7,912 $3,804 $92 $6,504 $3,210 $-14 $10,041 $-100 $9,941 $189 $9,752 $12,143 $4,532 $-123 $4,409 $77 $4,332 $2,846 $124 $2,970 $174 $2,796 $3,896 Income Taxes L! E E S-245 $4,141 $3,196 $149 $3,047 Lidl $9,752 $4,332 $2,796 $4,141 $3,047 Income After Taxes Other Income Income From Continuous Operations Income From Discontinued Operations Net Income EBITDA EBIT Basic Shares Outstanding Shares Outstanding Basic EPS EPS - Earnings Per Share $2,796 $3,227 L EEEEEEE $9,752 $11,215 $10,041 2,496 2,535 $3.91 $3.85 $4,332 $5,630 $4,532 2,467 2,510 $4,141 $4,066 $3,804 2.432 $3,047 $3,409 $3,210 2,396 $2,846 2,439 2,472 $1.15 2,500 $1.70 $1.66 2,528 $1.27 $1.76 $1.73 $1.13 $1.21 Reformulate Financial Statements Apply financial ratios and relationships with commentaries. Make a recommendation regrading which company has a better financial profile 

Step by Step Solution
There are 3 Steps involved in it
Step: 1

Get Instant Access to Expert-Tailored Solutions
See step-by-step solutions with expert insights and AI powered tools for academic success
Step: 2

Step: 3

Ace Your Homework with AI
Get the answers you need in no time with our AI-driven, step-by-step assistance
Get Started


