Answered step by step
Verified Expert Solution
Question
1 Approved Answer
For a cylindrical container, the shape of standing waves (like the waves that might form on the surface of your tea in a loud


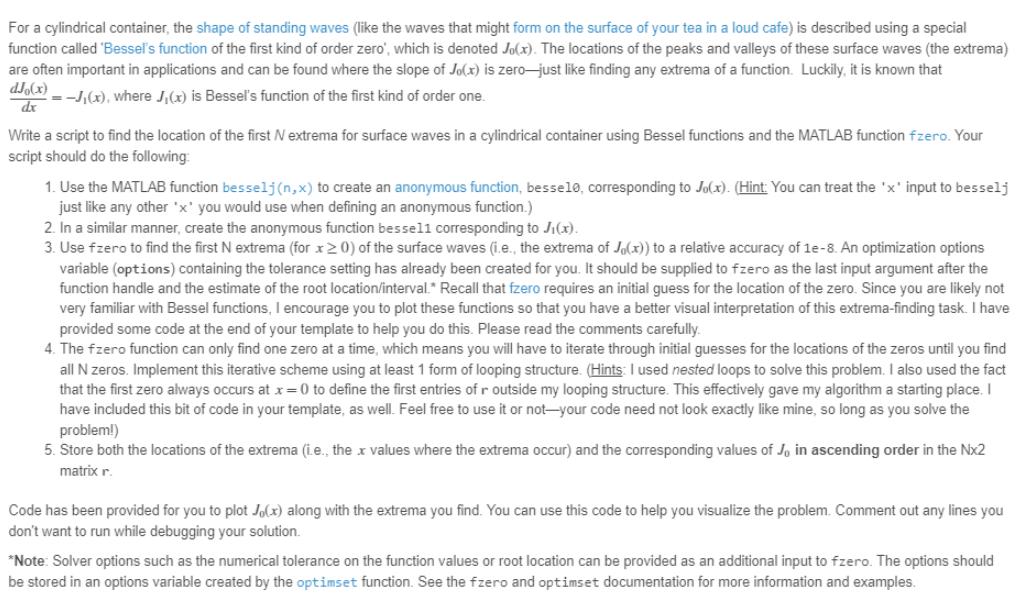
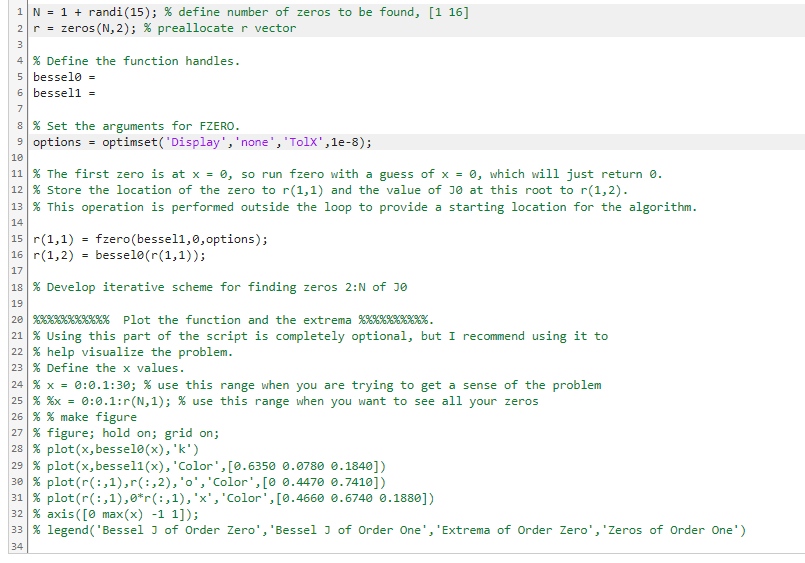
For a cylindrical container, the shape of standing waves (like the waves that might form on the surface of your tea in a loud cafe) is described using a special function called 'Bessel's function of the first kind of order zero', which is denoted Jo(x). The locations of the peaks and valleys of these surface waves (the extrema) are often important in applications and can be found where the slope of Jo(x) is zero-just like finding any extrema of a function. Luckily, it is known that dJo(x) =-J(x), where J(x) is Bessel's function of the first kind of order one. dx Write a script to find the location of the first N extrema for surface waves in a cylindrical container using Bessel functions and the MATLAB function fzero. Your script should do the following: 1. Use the MATLAB function besselj (n,x) to create an anonymous function, bessel0, corresponding to Jo(x). (Hint: You can treat the 'x' input to besselj just like any other 'x' you would use when defining an anonymous function.) 2. In a similar manner, create the anonymous function bessel1 corresponding to Ji(x). 3. Use fzero to find the first N extrema (for x 20) of the surface waves (i.e., the extrema of Jo(x)) to a relative accuracy of 1e-8. An optimization options variable (options) containing the tolerance setting has already been created for you. It should be supplied to fzero as the last input argument after the function handle and the estimate of the root location/interval.* Recall that fzero requires an initial guess for the location of the zero. Since you are likely not very familiar with Bessel functions, I encourage you to plot these functions so that you have a better visual interpretation of this extrema-finding task. I have provided some code at the end of your template to help you do this. Please read the comments carefully. 4. The fzero function can only find one zero at a time, which means you will have to iterate through initial guesses for the locations of the zeros until you find all N zeros. Implement this iterative scheme using at least 1 form of looping structure. (Hints: I used nested loops to solve this problem. I also used the fact that the first zero always occurs at x = 0 to define the first entries of r outside my looping structure. This effectively gave my algorithm a starting place. I have included this bit of code in your template, as well. Feel free to use it or not-your code need not look exactly like mine, so long as you solve the problem!) 5. Store both the locations of the extrema (i.e., the x values where the extrema occur) and the corresponding values of Jo in ascending order in the Nx2 matrix r. Code has been provided for you to plot Jo(x) along with the extrema you find. You can use this code to help you visualize the problem. Comment out any lines you don't want to run while debugging your solution. *Note: Solver options such as the numerical tolerance on the function values or root location can be provided as an additional input to fzero. The options should be stored in an options variable created by the optimset function. See the fzero and optimset documentation for more information and examples. 1 N = 1 + randi (15); % define number of zeros to be found, [116] 2 r = zeros (N, 2); % preallocate r vector 3 4 % Define the function handles. 5 bessel0 = 6 bessel1 = 7 8 % Set the arguments for FZERO. 9 options = optimset('Display','none', 'Tolx', le-8); 10 11 % The first zero is at x = 0, so run fzero with a guess of x = 0, which will just return 0. 12 % Store the location of the zero to r(1,1) and the value of J0 at this root to r(1,2). 13 % This operation is performed outside the loop to provide a starting location for the algorithm. 14 15 r(1,1)= fzero(bessel1,0, options); 16 r(1,2) bessel0 (r(1,1)); 17 = 18 % Develop iterative scheme for finding zeros 2:N of J 19 20 %%%%% Plot the function and the extrema %%%%%% 21 % Using this part of the script is completely optional, but I recommend using it to 22 % help visualize the problem. 23 % Define the x values. 24 % x = 0:0.1:30; % use this range when you are trying to get a sense of the problem 25 % %x = 0:0.1:r(N,1); % use this range when you want to see all your zeros 26 % % make figure 27 % figure; hold on; grid on; 28 % plot (x, bessel0 (x), 'k') 29 % plot (x, bessel1(x), 'Color', [0.6350 0.0780 0.1840]) 30 % plot (r(:,1),r(:,2), 'o', 'Color', [0 0.4470 0.7410]) 31 % plot (r(:,1),0*r(:,1), 'x', 'Color', [0.4660 0.6740 0.1880]) 32 % axis ( [0 max(x) -1 1]); 33 % legend('Bessel J of Order Zero', 'Bessel J of Order One', 'Extrema of Order Zero', 'Zeros of Order One') 34
Step by Step Solution
★★★★★
3.32 Rating (152 Votes )
There are 3 Steps involved in it
Step: 1
The skin friction coefficient Cf for a laminar boundary ...
Get Instant Access to Expert-Tailored Solutions
See step-by-step solutions with expert insights and AI powered tools for academic success
Step: 2

Step: 3

Ace Your Homework with AI
Get the answers you need in no time with our AI-driven, step-by-step assistance
Get Started


