You are a financial advisor who works with two asset classes: stocks and a risk-free asset (e.g., T-bills). The expected return of the market


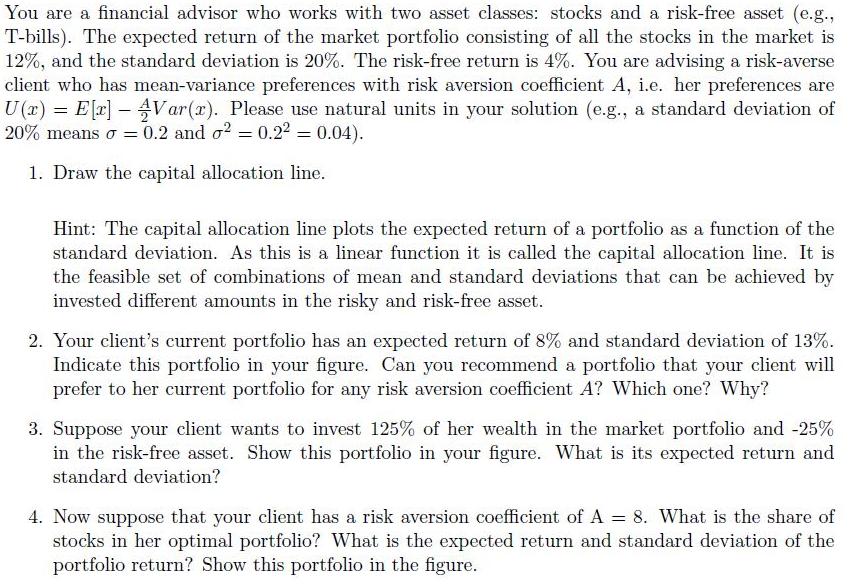
You are a financial advisor who works with two asset classes: stocks and a risk-free asset (e.g., T-bills). The expected return of the market portfolio consisting of all the stocks in the market is 12%, and the standard deviation is 20%. The risk-free return is 4%. You are advising a risk-averse client who has mean-variance preferences with risk aversion coefficient A, i.e. her preferences are U(x) = E[x] - Var(r). Please use natural units in your solution (e.g., a standard deviation of 20% means o = 0.2 and o2 = 0.22 = 0.04). 1. Draw the capital allocation line. Hint: The capital allocation line plots the expected return of a portfolio as a function of the standard deviation. As this is a linear function it is called the capital allocation line. It is the feasible set of combinations of mean and standard deviations that can be achieved by invested different amounts in the risky and risk-free asset. 2. Your client's current portfolio has an expected return of 8% and standard deviation of 13%. Indicate this portfolio in your figure. Can you recommend a portfolio that your client will prefer to her current portfolio for any risk aversion coefficient A? Which one? Why? 3. Suppose your client wants to invest 125% of her wealth in the market portfolio and -25% in the risk-free asset. Show this portfolio in your figure. What is its expected return and standard deviation? 4. Now suppose that your client has a risk aversion coefficient of A = 8. What is the share of stocks in her optimal portfolio? What is the expected return and standard deviation of the portfolio return? Show this portfolio in the figure. 5. Suppose that the risk-free borrowing rate is 6%, so that if you want to borrow you have to pay 6%; in contrast, the risk-free lending rate continues to be 4%. How does CAL change? In this case, what is the expected return and standard deviation of the portfolio in (3.)? Where is this portfolio in the diagram?
Step by Step Solution
There are 3 Steps involved in it
Step: 1
1 Draw the capital allocation line The capital allocation line CAL is a graphical representation of the feasible set of combinations of mean and standard deviations that can be achieved by invested di...
See step-by-step solutions with expert insights and AI powered tools for academic success
Step: 2

Step: 3

Ace Your Homework with AI
Get the answers you need in no time with our AI-driven, step-by-step assistance
Get Started


