Question
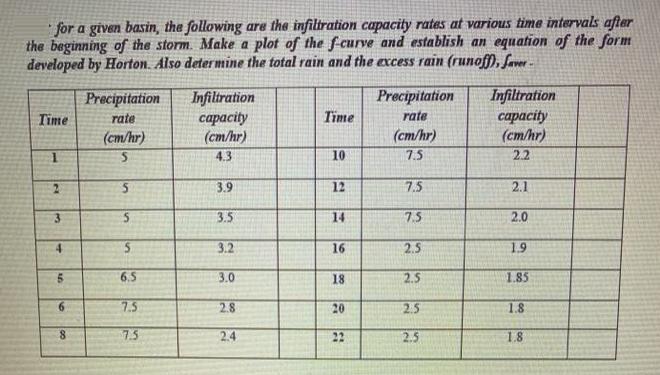
for a given basin, the following are the infiltration capacity rates at various time intervals after the beginning of the storm. Make a plot

for a given basin, the following are the infiltration capacity rates at various time intervals after the beginning of the storm. Make a plot of the f-curve and establish an equation of the form developed by Horton. Also determine the total rain and the excess rain (runoff), faver- Time 1 3 4 3 6 8 Precipitation rate (cm/hr) 5 S 5 5 6.5 7.5 7.5 Infiltration capacity (cm/hr) 4.3 3.9 3.5 3.2 3.0 2.8 2.4 Time 10 12 14 16 18 20 22 Precipitation rate (cm/hr) 7.5 7.5 7.5 2.5 2.5 2.5 2.5 Infiltration capacity (cm/hr) 2.2 2.1 2.0 1.9 1.85 1.8 1.8
Step by Step Solution
3.40 Rating (159 Votes )
There are 3 Steps involved in it
Step: 1
A B 1 Timehr Infiltration Capacity fcmhr 2 1 43 2 3 3 4 5 6 7 8 9 10 10 11 11 12 13 14 15 16 4 1 2 5 ...
Get Instant Access to Expert-Tailored Solutions
See step-by-step solutions with expert insights and AI powered tools for academic success
Step: 2

Step: 3

Ace Your Homework with AI
Get the answers you need in no time with our AI-driven, step-by-step assistance
Get StartedRecommended Textbook for
Hydrology and Floodplain Analysis
Authors: Philip B. Bedient, Wayne C. Huber, Baxter E. Vieux
5th edition
132567962, 978-0132567961
Students also viewed these Accounting questions
Question
Answered: 1 week ago
Question
Answered: 1 week ago
Question
Answered: 1 week ago
Question
Answered: 1 week ago
Question
Answered: 1 week ago
Question
Answered: 1 week ago
Question
Answered: 1 week ago
Question
Answered: 1 week ago
Question
Answered: 1 week ago
Question
Answered: 1 week ago
Question
Answered: 1 week ago
Question
Answered: 1 week ago
Question
Answered: 1 week ago
Question
Answered: 1 week ago
Question
Answered: 1 week ago
Question
Answered: 1 week ago
Question
Answered: 1 week ago
Question
Answered: 1 week ago
Question
Answered: 1 week ago
Question
Answered: 1 week ago
Question
Answered: 1 week ago
View Answer in SolutionInn App


