For Amazon years 2017, 2018, and 2019, calculate the cost of each capital component, after-tax cost of debt, cost of preferred, and cost of equity with the DCF method and CAPM method. What do you estimate the companys WACC? Please show all calculations.
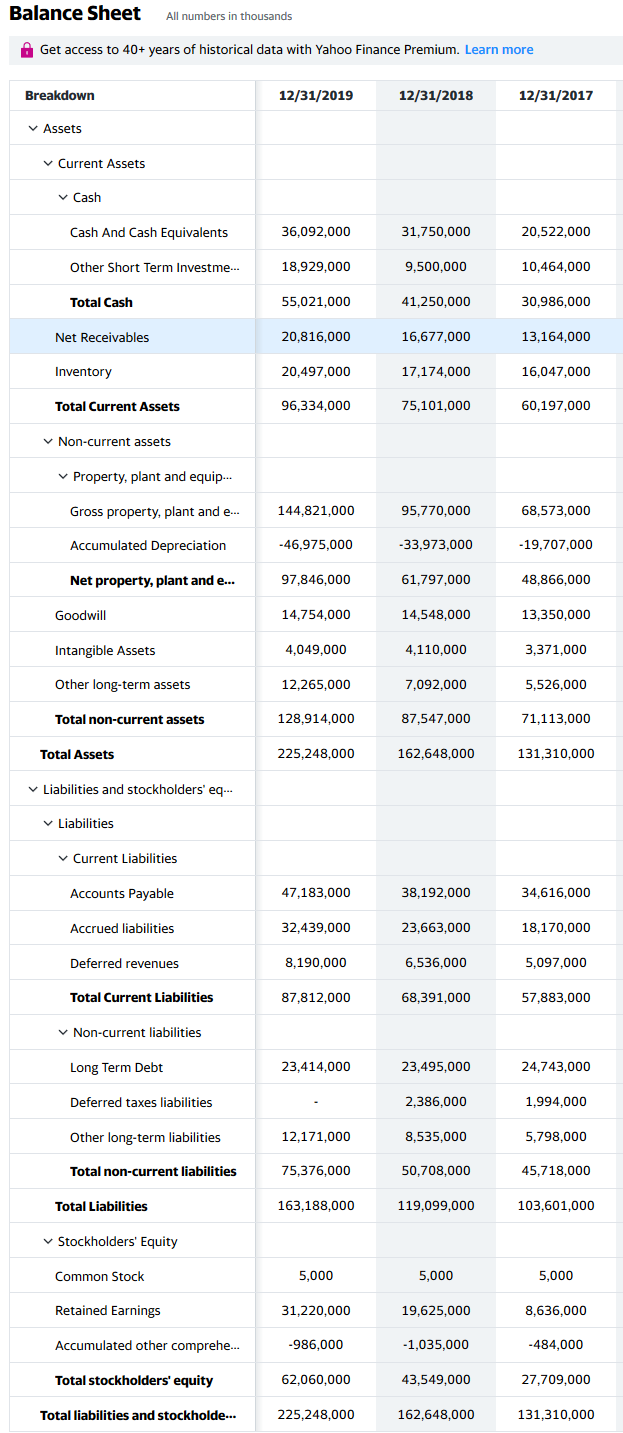
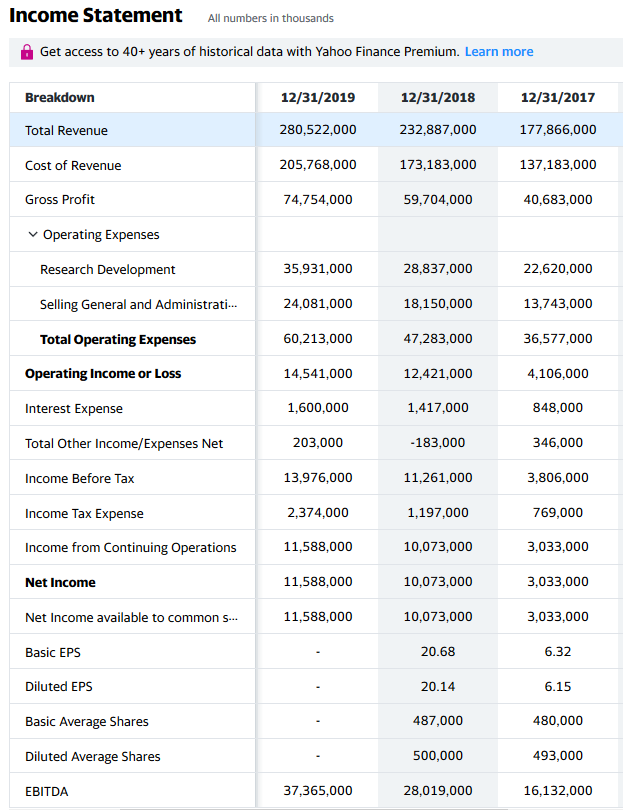
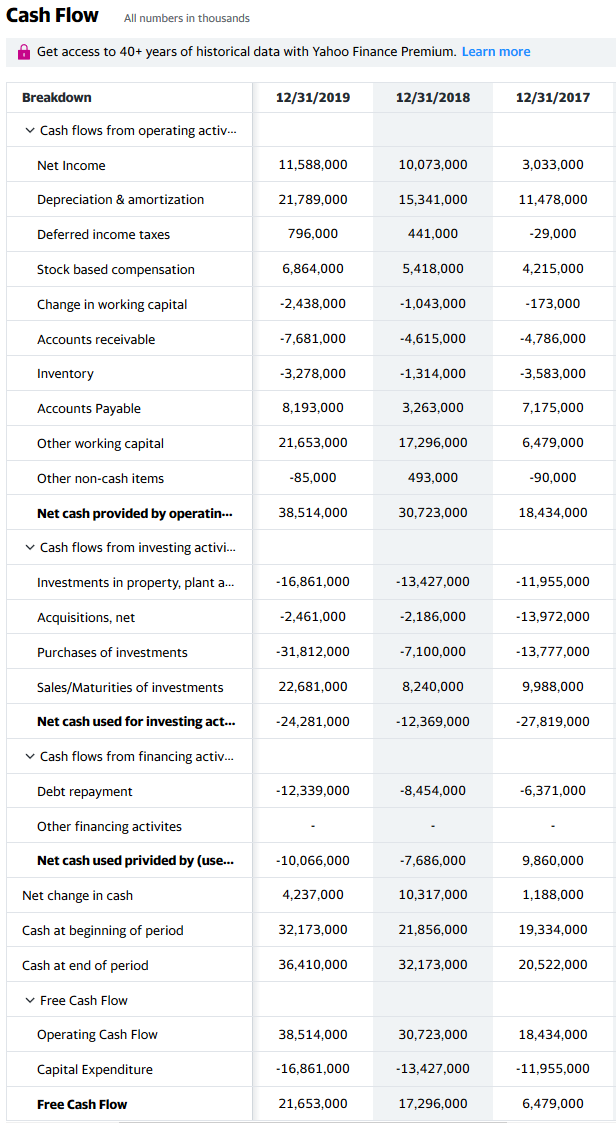
Balance Sheet All numbers in thousands Get access to 40+ years of historical data with Yahoo Finance Premium. Learn more Breakdown 12/31/2019 12/31/2018 12/31/2017 Assets Current Assets Cash Cash And Cash Equivalents 36,092,000 31,750,000 20,522,000 Other Short Term Investme... 18,929,000 9,500,000 10,464,000 Total Cash 55,021,000 41,250,000 30,986,000 Net Receivables 20,816,000 16,677,000 13,164,000 Inventory 20,497,000 17,174,000 16,047,000 Total Current Assets 96,334,000 75,101,000 60,197,000 Non-current assets Property, plant and equip... Gross property, plant and e... 144.821,000 95,770,000 68,573,000 Accumulated Depreciation -46.975,000 -33,973,000 -19,707,000 Net property, plant and e... 97,846,000 61,797,000 48,866,000 Goodwill 14,754,000 14,548,000 13,350,000 Intangible Assets 4,049,000 4,110,000 3,371,000 Other long-term assets 12,265,000 7,092,000 5,526,000 Total non-current assets 128,914,000 87,547,000 71,113,000 Total Assets 225,248,000 162,648,000 131,310,000 Liabilities and stockholders' eq... Liabilities Current Liabilities Accounts Payable 47,183,000 38,192,000 34,616,000 Accrued liabilities 32,439,000 23,663,000 18,170,000 Deferred revenues 8,190,000 6,536,000 5,097,000 Total Current Liabilities 87,812,000 68,391,000 57,883,000 Non-current liabilities Long Term Debt 23,414,000 23,495,000 24,743,000 Deferred taxes liabilities 2,386,000 1,994,000 Other long-term liabilities 12,171,000 8,535,000 5,798,000 Total non-current liabilities 75,376,000 50,708,000 45,718,000 Total Liabilities 163,188,000 119,099,000 103,601,000 Stockholders' Equity Common Stock 5,000 5,000 5,000 Retained Earnings 31,220,000 19,625,000 8,636,000 Accumulated other comprehe... -986,000 -1,035,000 -484,000 Total stockholders' equity 62,060,000 43,549,000 27,709,000 Total liabilities and stockholde... 225,248,000 162,648,000 131,310,000 Income Statement All numbers in thousands Get access to 40+ years of historical data with Yahoo Finance Premium. Learn more Breakdown 12/31/2019 12/31/2018 12/31/2017 Total Revenue 280,522,000 232,887,000 177,866,000 Cost of Revenue 205,768,000 173,183,000 137,183,000 Gross Profit 74,754,000 59,704,000 40,683,000 Operating Expenses Research Development 35,931,000 28,837,000 22,620,000 Selling General and Administrati... 24,081,000 18,150,000 13,743,000 Total Operating Expenses 60,213,000 47,283,000 36,577,000 Operating Income or Loss 14,541,000 12,421,000 4,106,000 Interest Expense 1,600,000 1,417,000 848,000 Total Other Income/Expenses Net 203,000 -183,000 346,000 Income Before Tax 13,976,000 11,261,000 3,806,000 Income Tax Expense 2,374,000 1,197,000 769,000 Income from Continuing Operations 11,588,000 10,073,000 3,033,000 Net Income 11,588,000 10,073,000 3,033,000 Net Income available to common S... 11,588,000 10,073,000 3,033,000 Basic EPS 20.68 6.32 Diluted EPS 20.14 6.15 Basic Average Shares 487,000 480,000 Diluted Average Shares 500,000 493,000 EBITDA 37,365,000 28,019,000 16,132,000 Cash Flow All numbers in thousands Get access to 40+ years of historical data with Yahoo Finance Premium. Learn more Breakdown 12/31/2019 12/31/2018 12/31/2017 Cash flows from operating activ... Net Income 11,588,000 10,073,000 3,033,000 Depreciation & amortization 21,789,000 15,341,000 11,478,000 Deferred income taxes 796,000 441,000 -29.000 Stock based compensation 6,864,000 5,418,000 4,215,000 Change in working capital -2,438,000 - 1,043,000 -173,000 Accounts receivable -7,681,000 -4,615,000 -4,786,000 Inventory -3,278,000 -1,314,000 -3,583,000 Accounts Payable 8,193,000 3,263,000 7,175,000 Other working capital 21,653,000 17,296,000 6,479,000 Other non-cash items -85,000 493,000 -90,000 Net cash provided by operatin... 38,514,000 30,723,000 18,434,000 Cash flows from investing activi... Investments in property, plant a... - 16,861,000 - 13,427,000 -11,955,000 Acquisitions, net -2,461,000 -2,186,000 -13,972,000 Purchases of investments -31,812,000 -7,100,000 - 13,777,000 Sales/Maturities of investments 22.681,000 8,240,000 9,988,000 Net cash used for investing act... -24,281,000 -12,369,000 -27,819,000 Cash flows from financing activ... Debt repayment -12,339,000 -8,454,000 -6,371,000 Other financing activites Net cash used privided by (use... -10,066,000 -7,686,000 9,860,000 Net change in cash 4,237,000 10,317,000 1,188,000 Cash at beginning of period 32,173,000 21,856,000 19,334,000 Cash at end of period 36,410,000 32,173,000 20,522,000 Free Cash Flow Operating Cash Flow 38,514,000 30,723,000 18,434,000 Capital Expenditure - 16,861,000 - 13,427,000 -11,955,000 Free Cash Flow 21,653,000 17,296,000 6,479,000 Balance Sheet All numbers in thousands Get access to 40+ years of historical data with Yahoo Finance Premium. Learn more Breakdown 12/31/2019 12/31/2018 12/31/2017 Assets Current Assets Cash Cash And Cash Equivalents 36,092,000 31,750,000 20,522,000 Other Short Term Investme... 18,929,000 9,500,000 10,464,000 Total Cash 55,021,000 41,250,000 30,986,000 Net Receivables 20,816,000 16,677,000 13,164,000 Inventory 20,497,000 17,174,000 16,047,000 Total Current Assets 96,334,000 75,101,000 60,197,000 Non-current assets Property, plant and equip... Gross property, plant and e... 144.821,000 95,770,000 68,573,000 Accumulated Depreciation -46.975,000 -33,973,000 -19,707,000 Net property, plant and e... 97,846,000 61,797,000 48,866,000 Goodwill 14,754,000 14,548,000 13,350,000 Intangible Assets 4,049,000 4,110,000 3,371,000 Other long-term assets 12,265,000 7,092,000 5,526,000 Total non-current assets 128,914,000 87,547,000 71,113,000 Total Assets 225,248,000 162,648,000 131,310,000 Liabilities and stockholders' eq... Liabilities Current Liabilities Accounts Payable 47,183,000 38,192,000 34,616,000 Accrued liabilities 32,439,000 23,663,000 18,170,000 Deferred revenues 8,190,000 6,536,000 5,097,000 Total Current Liabilities 87,812,000 68,391,000 57,883,000 Non-current liabilities Long Term Debt 23,414,000 23,495,000 24,743,000 Deferred taxes liabilities 2,386,000 1,994,000 Other long-term liabilities 12,171,000 8,535,000 5,798,000 Total non-current liabilities 75,376,000 50,708,000 45,718,000 Total Liabilities 163,188,000 119,099,000 103,601,000 Stockholders' Equity Common Stock 5,000 5,000 5,000 Retained Earnings 31,220,000 19,625,000 8,636,000 Accumulated other comprehe... -986,000 -1,035,000 -484,000 Total stockholders' equity 62,060,000 43,549,000 27,709,000 Total liabilities and stockholde... 225,248,000 162,648,000 131,310,000 Income Statement All numbers in thousands Get access to 40+ years of historical data with Yahoo Finance Premium. Learn more Breakdown 12/31/2019 12/31/2018 12/31/2017 Total Revenue 280,522,000 232,887,000 177,866,000 Cost of Revenue 205,768,000 173,183,000 137,183,000 Gross Profit 74,754,000 59,704,000 40,683,000 Operating Expenses Research Development 35,931,000 28,837,000 22,620,000 Selling General and Administrati... 24,081,000 18,150,000 13,743,000 Total Operating Expenses 60,213,000 47,283,000 36,577,000 Operating Income or Loss 14,541,000 12,421,000 4,106,000 Interest Expense 1,600,000 1,417,000 848,000 Total Other Income/Expenses Net 203,000 -183,000 346,000 Income Before Tax 13,976,000 11,261,000 3,806,000 Income Tax Expense 2,374,000 1,197,000 769,000 Income from Continuing Operations 11,588,000 10,073,000 3,033,000 Net Income 11,588,000 10,073,000 3,033,000 Net Income available to common S... 11,588,000 10,073,000 3,033,000 Basic EPS 20.68 6.32 Diluted EPS 20.14 6.15 Basic Average Shares 487,000 480,000 Diluted Average Shares 500,000 493,000 EBITDA 37,365,000 28,019,000 16,132,000 Cash Flow All numbers in thousands Get access to 40+ years of historical data with Yahoo Finance Premium. Learn more Breakdown 12/31/2019 12/31/2018 12/31/2017 Cash flows from operating activ... Net Income 11,588,000 10,073,000 3,033,000 Depreciation & amortization 21,789,000 15,341,000 11,478,000 Deferred income taxes 796,000 441,000 -29.000 Stock based compensation 6,864,000 5,418,000 4,215,000 Change in working capital -2,438,000 - 1,043,000 -173,000 Accounts receivable -7,681,000 -4,615,000 -4,786,000 Inventory -3,278,000 -1,314,000 -3,583,000 Accounts Payable 8,193,000 3,263,000 7,175,000 Other working capital 21,653,000 17,296,000 6,479,000 Other non-cash items -85,000 493,000 -90,000 Net cash provided by operatin... 38,514,000 30,723,000 18,434,000 Cash flows from investing activi... Investments in property, plant a... - 16,861,000 - 13,427,000 -11,955,000 Acquisitions, net -2,461,000 -2,186,000 -13,972,000 Purchases of investments -31,812,000 -7,100,000 - 13,777,000 Sales/Maturities of investments 22.681,000 8,240,000 9,988,000 Net cash used for investing act... -24,281,000 -12,369,000 -27,819,000 Cash flows from financing activ... Debt repayment -12,339,000 -8,454,000 -6,371,000 Other financing activites Net cash used privided by (use... -10,066,000 -7,686,000 9,860,000 Net change in cash 4,237,000 10,317,000 1,188,000 Cash at beginning of period 32,173,000 21,856,000 19,334,000 Cash at end of period 36,410,000 32,173,000 20,522,000 Free Cash Flow Operating Cash Flow 38,514,000 30,723,000 18,434,000 Capital Expenditure - 16,861,000 - 13,427,000 -11,955,000 Free Cash Flow 21,653,000 17,296,000 6,479,000