

Answered step by step
Verified Expert Solution
Question
1 Approved Answer
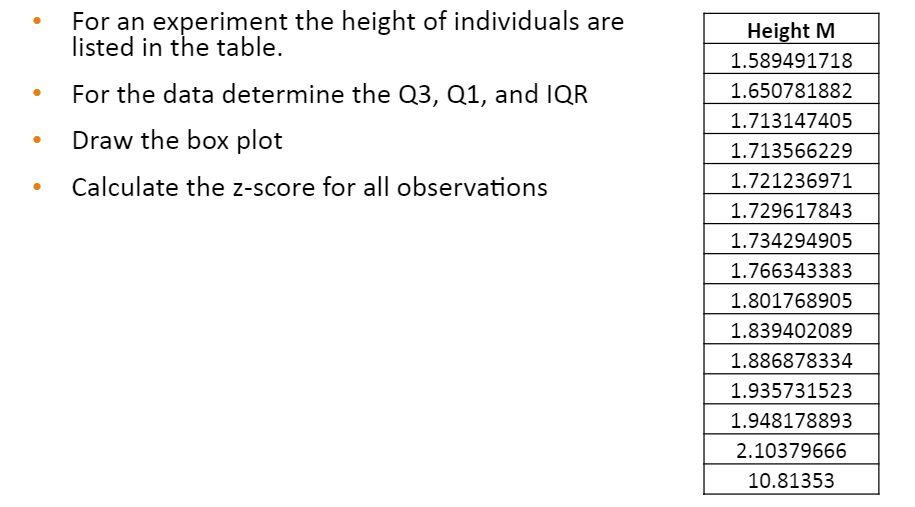
For an experiment the height of individuals are listed in the table. For the data determine the Q3, Q1, and IQR Draw the box plot
Step by Step Solution
There are 3 Steps involved in it
Step: 1

Get Instant Access to Expert-Tailored Solutions
See step-by-step solutions with expert insights and AI powered tools for academic success
Step: 2

Step: 3
Ace Your Homework with AI
Get the answers you need in no time with our AI-driven, step-by-step assistance
Get Started
SQL Instant Reference
Authors: Gruber, Martin Gruber
2nd Edition
0782125395, 9780782125399