

Answered step by step
Verified Expert Solution
Question
1 Approved Answer
FOR C don't forget to give the answer in four decimal places, and lastly for annual standard deviation of portofolio Use the accompanying data to
 FOR C don't forget to give the answer in four decimal places, and lastly for annual standard deviation of portofolio
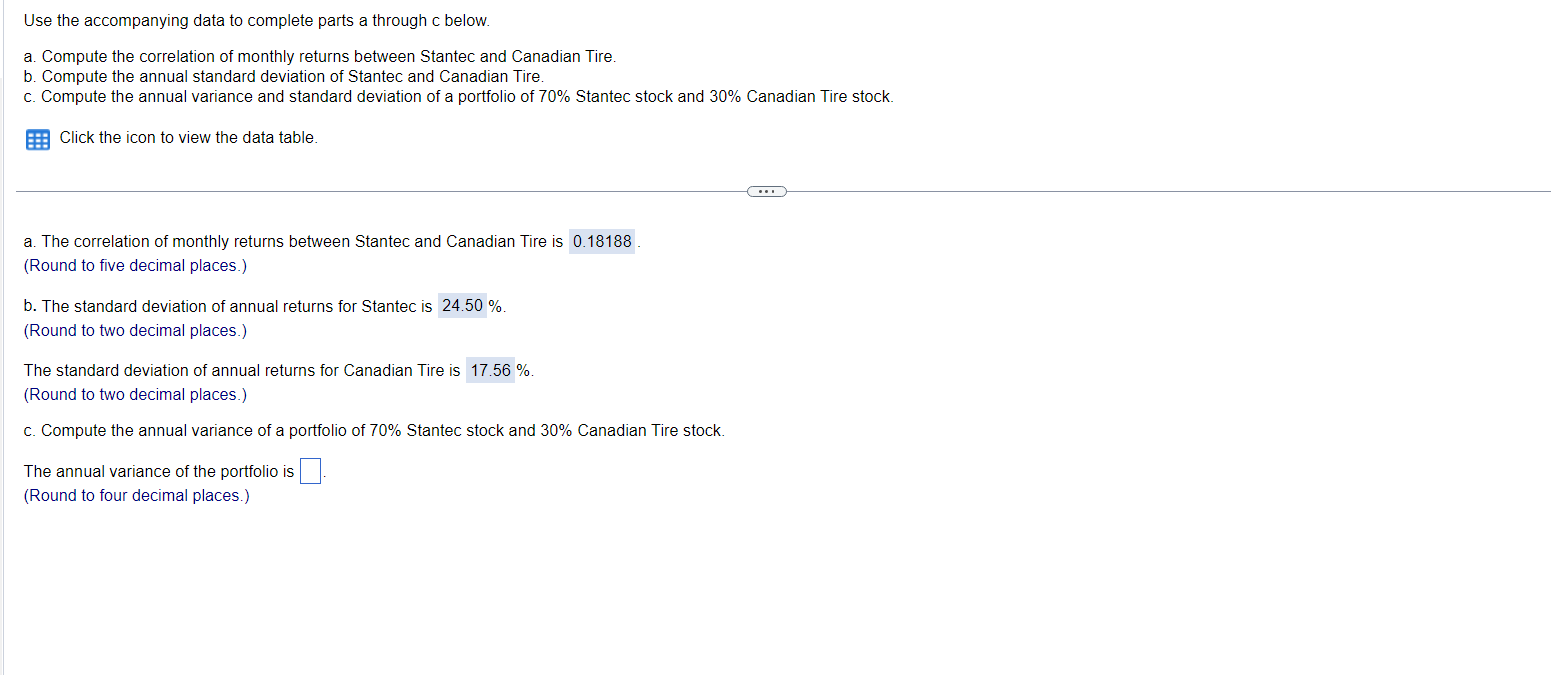
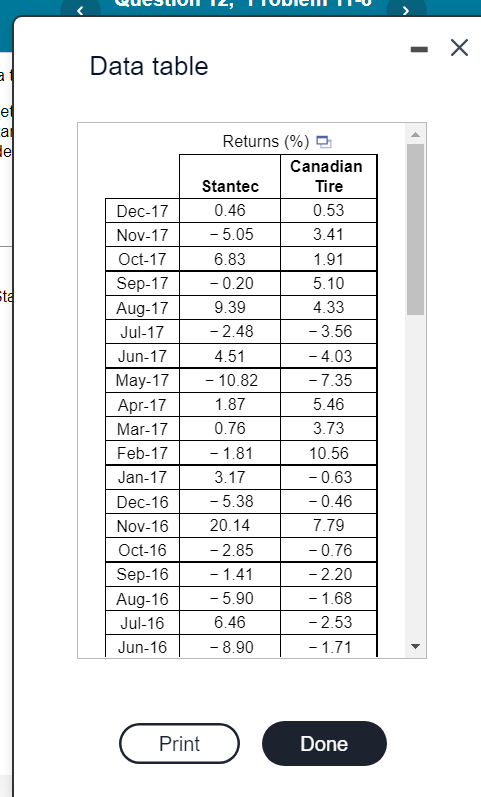
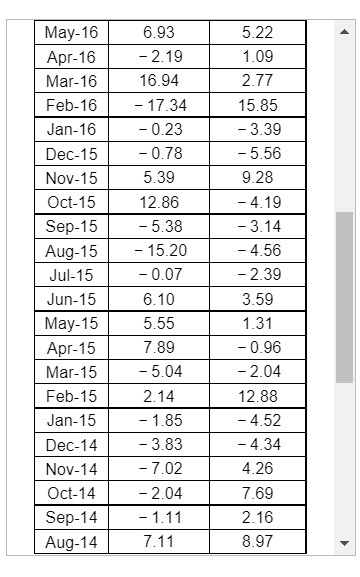
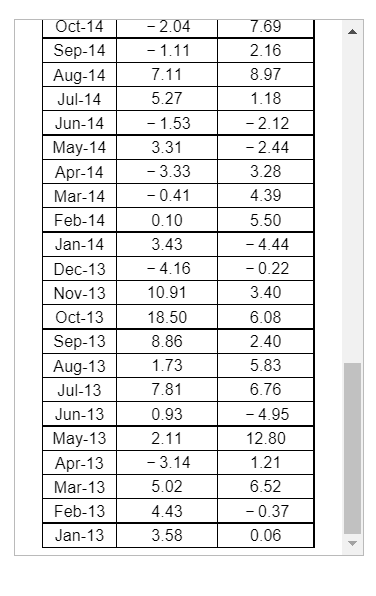
Use the accompanying data to complete parts a through c below. a. Compute the correlation of monthly returns between Stantec and Canadian Tire. b. Compute the annual standard deviation of Stantec and Canadian Tire. c. Compute the annual variance and standard deviation of a portfolio of 70% Stantec stock and 30% Canadian Tire stock. Click the icon to view the data table. a. The correlation of monthly returns between Stantec and Canadian Tire is (Round to five decimal places.) b. The standard deviation of annual returns for Stantec is %. (Round to two decimal places.) The standard deviation of annual returns for Canadian Tire is Io. (Round to two decimal places.) c. Compute the annual variance of a portfolio of 70% Stantec stock and 30% Canadian Tire stock. The annual variance of the portfolio is (Round to four decimal places.) Data table \begin{tabular}{|c|c|c|} \hline May-16 & 6.93 & 5.22 \\ \hline Apr-16 & 2.19 & 1.09 \\ \hline Mar-16 & 16.94 & 2.77 \\ \hline Feb-16 & 17.34 & 15.85 \\ \hline Jan-16 & 0.23 & 3.39 \\ \hline Dec-15 & 0.78 & 5.56 \\ \hline Nov-15 & 5.39 & 9.28 \\ \hline Oct-15 & 12.86 & 4.19 \\ \hline Sep-15 & 5.38 & 3.14 \\ \hline Aug-15 & 15.20 & 4.56 \\ \hline Jul-15 & 0.07 & 2.39 \\ \hline Jun-15 & 6.10 & 3.59 \\ \hline May-15 & 5.55 & 1.31 \\ \hline Apr-15 & 7.89 & 0.96 \\ \hline Mar-15 & 5.04 & 2.04 \\ \hline Feb-15 & 2.14 & 12.88 \\ \hline Jan-15 & 1.85 & 4.52 \\ \hline Dec-14 & 3.83 & 4.34 \\ \hline Nov-14 & 7.02 & 4.26 \\ \hline Oct-14 & 2.04 & 7.69 \\ \hline Sep-14 & 1.11 & 2.16 \\ \hline Aug-14 & 7.11 & 8.97 \\ \hline \end{tabular} \begin{tabular}{|c|c|c|} \hline Oct-14 & 2.04 & 7.69 \\ \hline Sep-14 & 1.11 & 2.16 \\ \hline Aug-14 & 7.11 & 8.97 \\ \hline Jul-14 & 5.27 & 1.18 \\ \hline Jun-14 & 1.53 & 2.12 \\ \hline May-14 & 3.31 & 2.44 \\ \hline Apr-14 & 3.33 & 3.28 \\ \hline Mar-14 & 0.41 & 4.39 \\ \hline Feb-14 & 0.10 & 5.50 \\ \hline Jan-14 & 3.43 & 4.44 \\ \hline Dec-13 & 4.16 & 0.22 \\ \hline Nov-13 & 10.91 & 3.40 \\ \hline Oct-13 & 18.50 & 6.08 \\ \hline Sep-13 & 8.86 & 2.40 \\ \hline Aug-13 & 1.73 & 5.83 \\ \hline Jul-13 & 7.81 & 6.76 \\ \hline Jun-13 & 0.93 & 4.95 \\ \hline May-13 & 2.11 & 12.80 \\ \hline Apr-13 & 3.14 & 1.21 \\ \hline Mar-13 & 5.02 & 6.52 \\ \hline Feb-13 & 4.43 & 0.37 \\ \hline Jan-13 & 3.58 & 0.06 \\ \hline \end{tabular}
Step by Step Solution
There are 3 Steps involved in it
Step: 1

Get Instant Access to Expert-Tailored Solutions
See step-by-step solutions with expert insights and AI powered tools for academic success
Step: 2

Step: 3
Ace Your Homework with AI
Get the answers you need in no time with our AI-driven, step-by-step assistance
Get Started
School Finance A Policy Perspective
Authors: Allan Odden, Lawrence Picus
6th Edition
1259922316, 9781259922312