Answered step by step
Verified Expert Solution
Question
1 Approved Answer
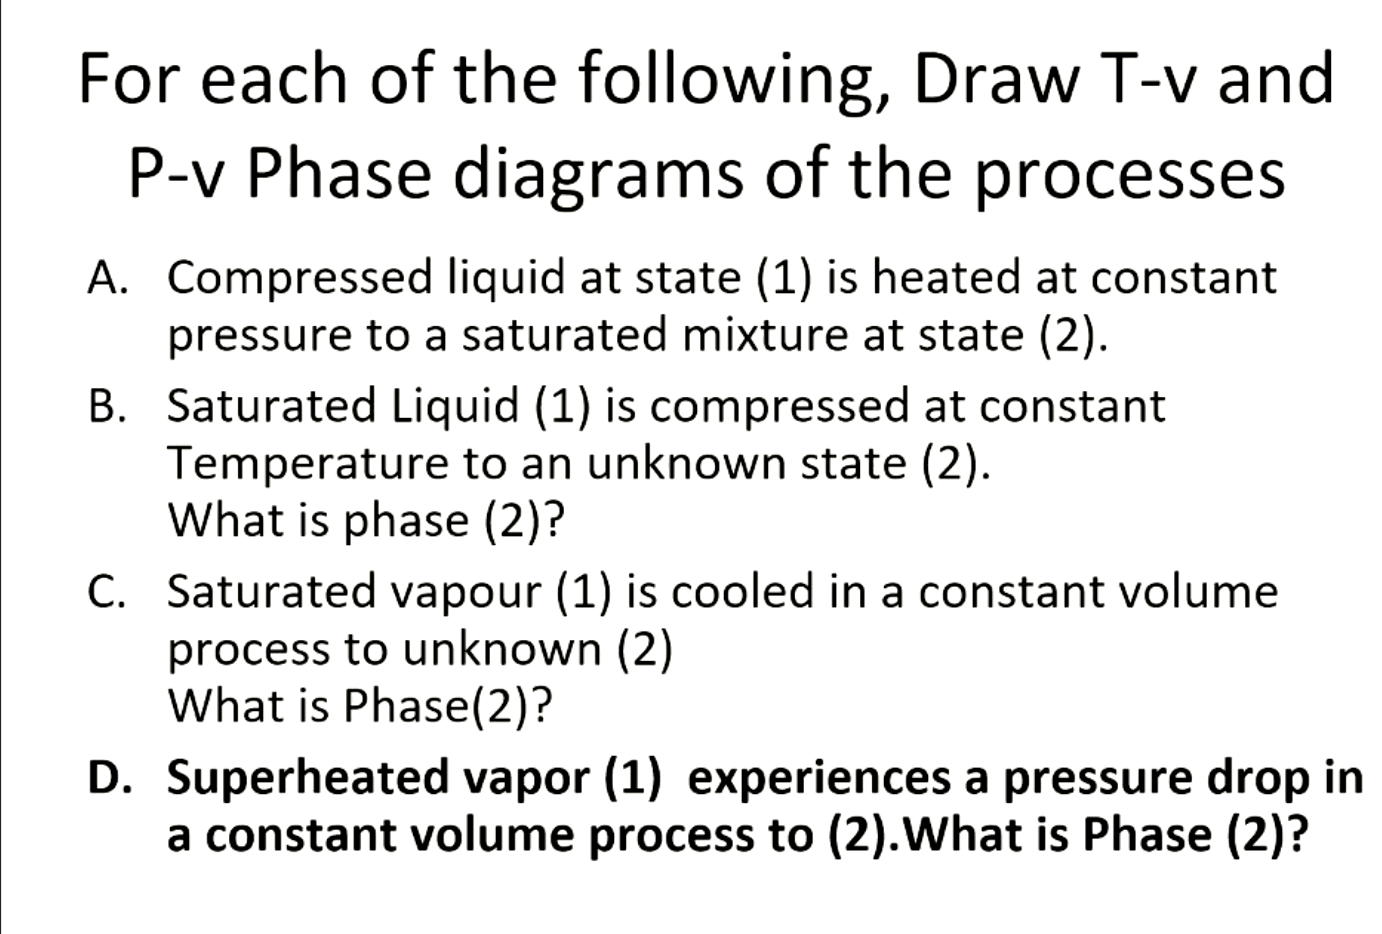
For each of the following, Draw T-v and P-v Phase diagrams of the processes A. Compressed liquid at state (1) is heated at constant

For each of the following, Draw T-v and P-v Phase diagrams of the processes A. Compressed liquid at state (1) is heated at constant pressure to a saturated mixture at state (2). B. Saturated Liquid (1) is compressed at constant Temperature to an unknown state (2). What is phase (2)? C. Saturated vapour (1) is cooled in a constant volume process to unknown (2) What is Phase(2)? D. Superheated vapor (1) experiences a pressure drop in a constant volume process to (2). What is Phase (2)?
Step by Step Solution
There are 3 Steps involved in it
Step: 1
The graph shows that there is a modest increase in volume with rising temperature from points 1 to 2 ...
Get Instant Access to Expert-Tailored Solutions
See step-by-step solutions with expert insights and AI powered tools for academic success
Step: 2

Step: 3

Ace Your Homework with AI
Get the answers you need in no time with our AI-driven, step-by-step assistance
Get Started


