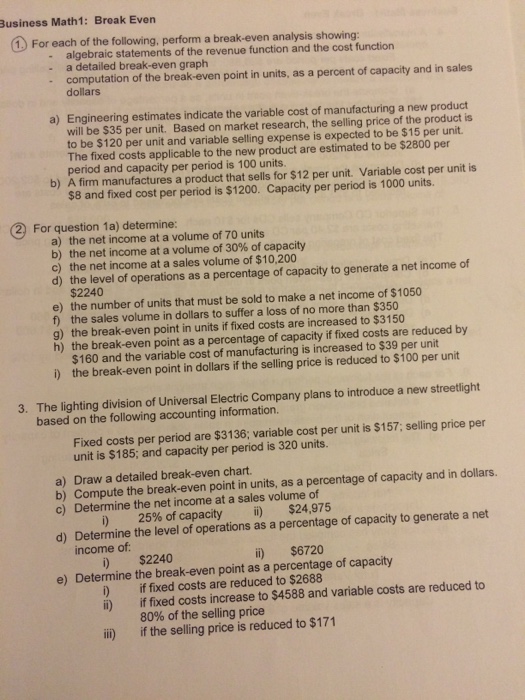
For each of the following, perform a break-even analysis showing: algebraic statements of the revenue function and the cost function a detailed break-even graph computation of the break-even point in units, as a percent of capacity and in sales dollars Engineering estimates indicate the variable cost of manufacturing a new product will be $35 per unit. Based on market research, the selling price of the product is to be $120 per unit and variable selling expense is expected to be $15 per unit The fixed costs applicable to the new product are estimated to be $2800 per period and capacity per period is 100 units. A firm manufactures a product that sells for $12 per unit. Variable cost per unit is $8 and fixed cost per period is $1200. Capacity per period is 1000 units. For question determine: the net income at a volume of 70 units the net income at a volume of 30% of capacity the net income at a sales volume of $10,200 the level of operations as a percentage of capacity to generate a net income of $2240 the number of units that must be sold to make a net income of $1050 0 the sales volume in dollars to suffer a loss of no more than $350 the break-even point in units if fixed costs are increased to $3150 the break-even point as a percentage of capacity if fixed costs are reduced by $160 and the variable cost of manufacturing is increased to $39 per unit the break-even point in dollars if the selling price is reduced to $100 per unit The lighting division of Universal Electric Company plans to introduce a new streetlight based on the following accounting information. Fixed costs per period are $3136; variable cost per unit is $157; selling price per unit is $185; and capacity per period is 320 units. Draw a detailed break-even chart. Compute the break-even point in units, as a percentage of capacity and in dollars. Determine the net income at a sales volume of Determine the level of operations as a percentage of capacity to generate a net income of; Determine the break-even point as a percentage of capacity