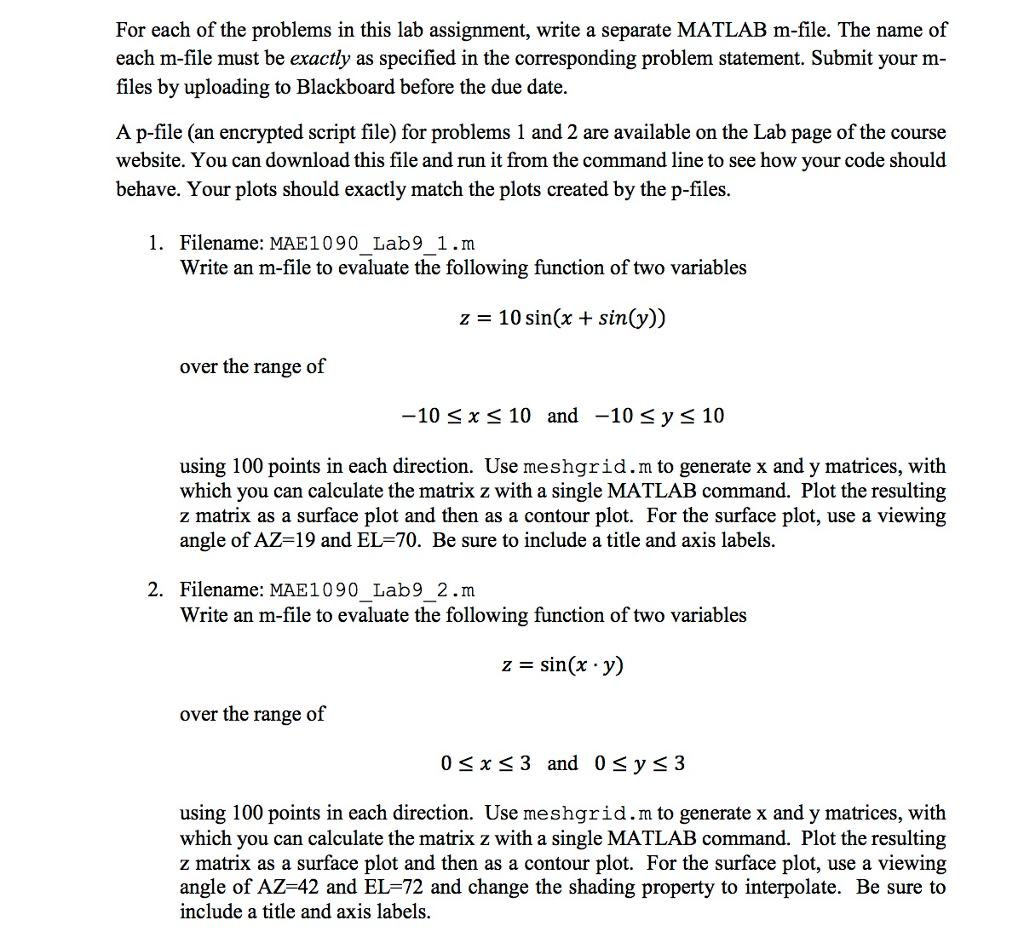
For each of the problems in this lab assignment, write a separate MATLAB m-file. The name of each m-file must be exactly as specified in the corresponding problem statement. Submit your m files by uploading to Blackboard before the due date. A p-file (an encrypted script file) for problems 1 and 2 are available on the Lab page of the course website. You can download this file and run it from the command line to see how your code should behave. Your plots should exactly match the plots created by the p-files. Filename: MAE1090_Lab9_1.m Write an m-file to evaluate the following function of two variables z = 10 sin (x + sin(y)) over the range of -10 lessthanorequalto x lessthanorequalto 10 and -10 lessthanorequalto y lessthanorequalto 10 using 100 points in each direction. Use meshgrid.m to generate x and y matrices, with which you can calculate the matrix z with a single MATLAB command. Plot the resulting z matrix as a surface plot and then as a contour plot. For the surface plot, use a viewing angle of AZ=19 and EL=70. Be sure to include a title and axis labels. Filename: MAE1090_Lab 9_2.m Write an m-file to evaluate the following function of two variables z = sin(x middot y) over the range of 0 lessthanorequalto x lessthanorequalto 3 and 0 lessthanorequalto y lessthanorequalto 3 using 100 points in each direction. Use meshgrid.m to generate x and y matrices, with which you can calculate the matrix z with a single MATLAB command. Plot the resulting z matrix as a surface plot and then as a contour plot. For the surface plot, use a viewing angle of AZ=42 and EL=72 and change the shading property to interpolate. Be sure to include a title and axis labels. For each of the problems in this lab assignment, write a separate MATLAB m-file. The name of each m-file must be exactly as specified in the corresponding problem statement. Submit your m files by uploading to Blackboard before the due date. A p-file (an encrypted script file) for problems 1 and 2 are available on the Lab page of the course website. You can download this file and run it from the command line to see how your code should behave. Your plots should exactly match the plots created by the p-files. Filename: MAE1090_Lab9_1.m Write an m-file to evaluate the following function of two variables z = 10 sin (x + sin(y)) over the range of -10 lessthanorequalto x lessthanorequalto 10 and -10 lessthanorequalto y lessthanorequalto 10 using 100 points in each direction. Use meshgrid.m to generate x and y matrices, with which you can calculate the matrix z with a single MATLAB command. Plot the resulting z matrix as a surface plot and then as a contour plot. For the surface plot, use a viewing angle of AZ=19 and EL=70. Be sure to include a title and axis labels. Filename: MAE1090_Lab 9_2.m Write an m-file to evaluate the following function of two variables z = sin(x middot y) over the range of 0 lessthanorequalto x lessthanorequalto 3 and 0 lessthanorequalto y lessthanorequalto 3 using 100 points in each direction. Use meshgrid.m to generate x and y matrices, with which you can calculate the matrix z with a single MATLAB command. Plot the resulting z matrix as a surface plot and then as a contour plot. For the surface plot, use a viewing angle of AZ=42 and EL=72 and change the shading property to interpolate. Be sure to include a title and axis labels


