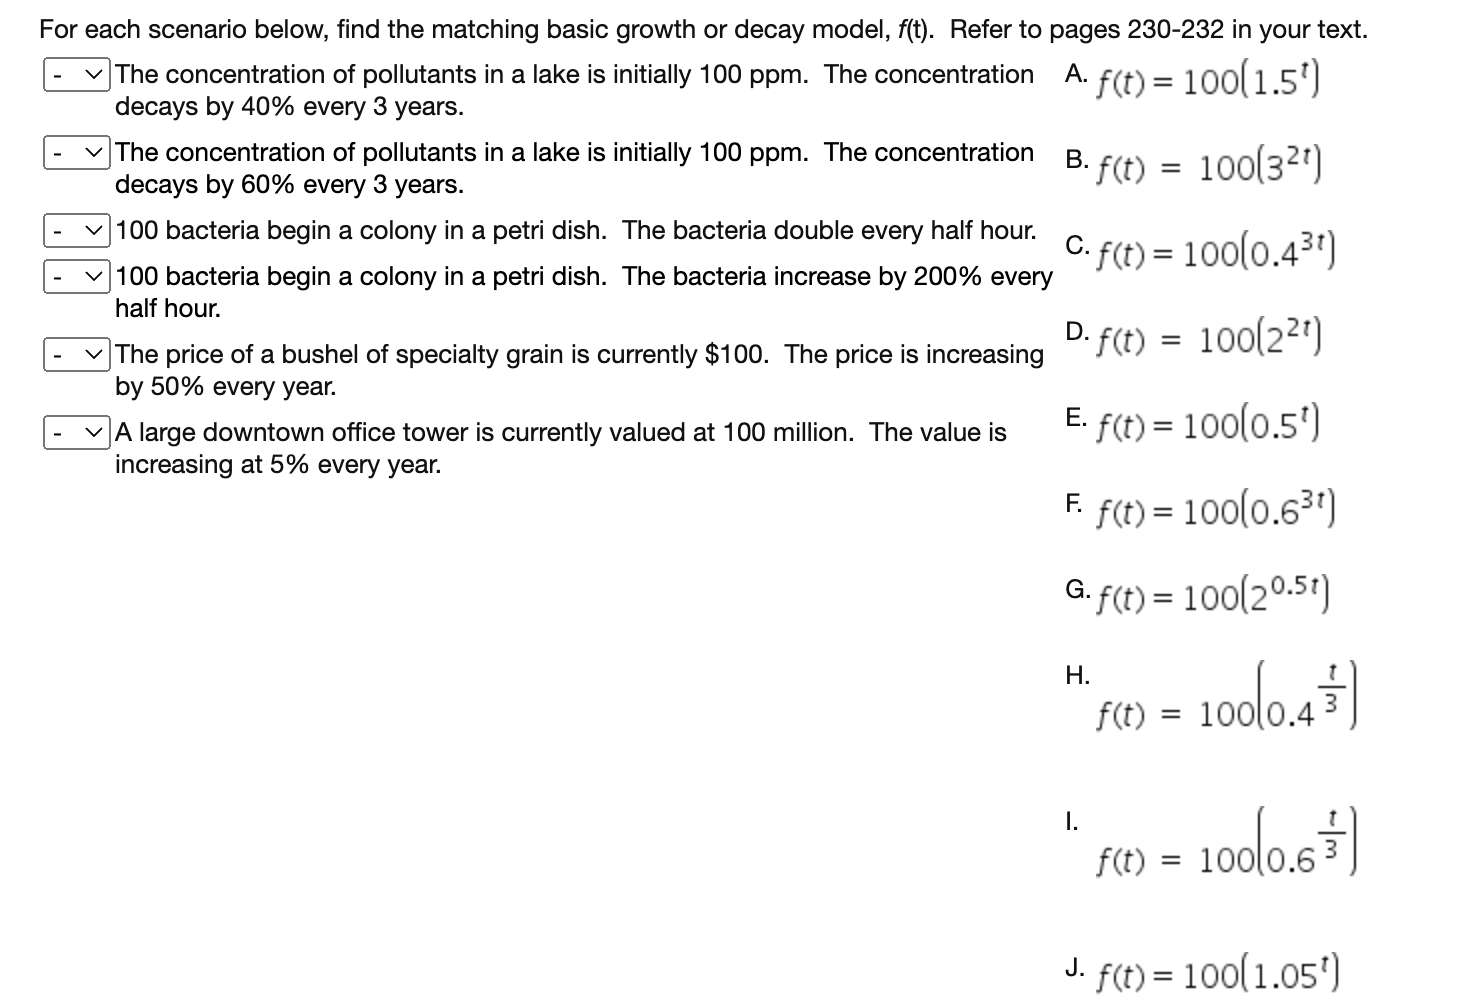
For each scenario below, find the matching basic growth or decay model, f(t). Refer to pages 230-232 in your text. - The concentration of pollutants
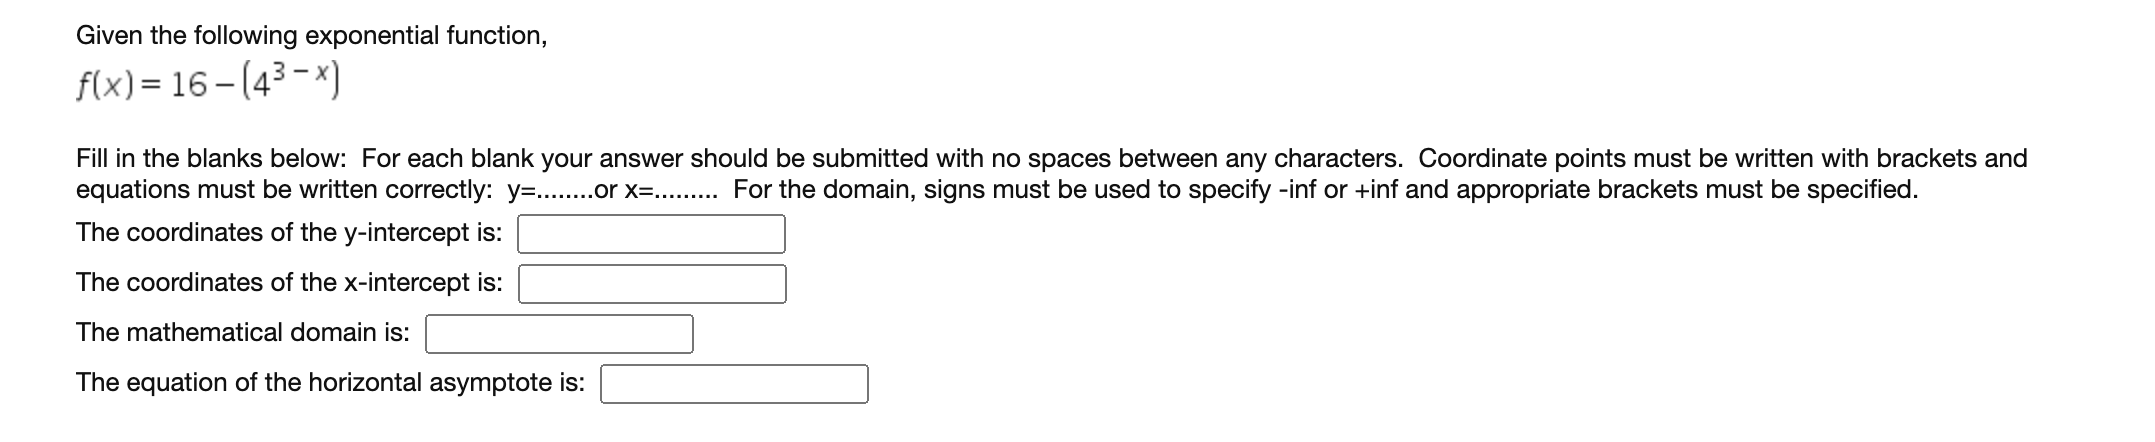
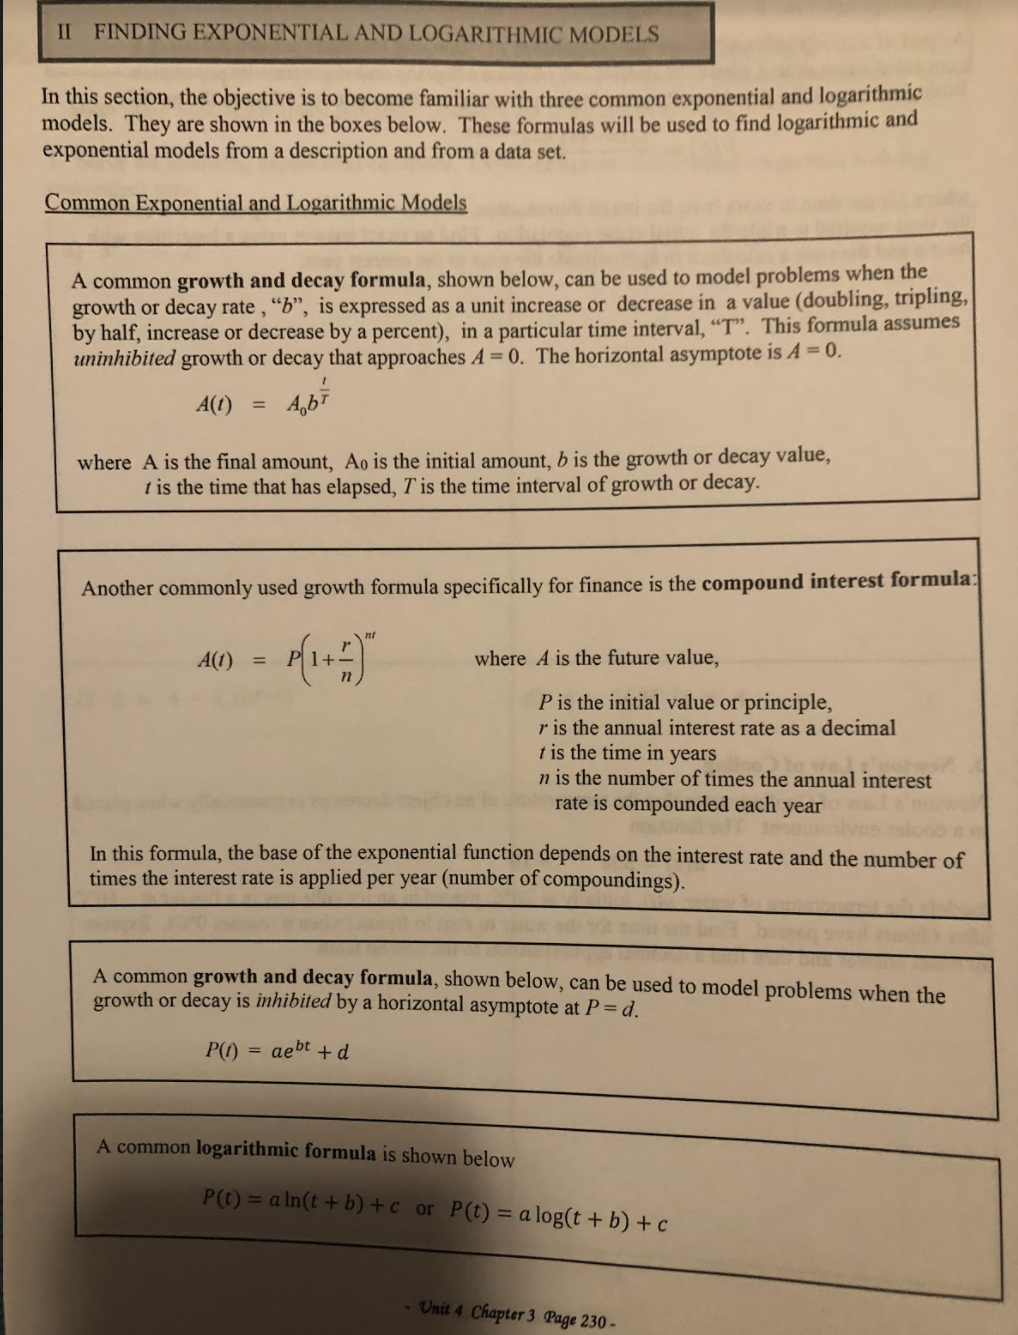
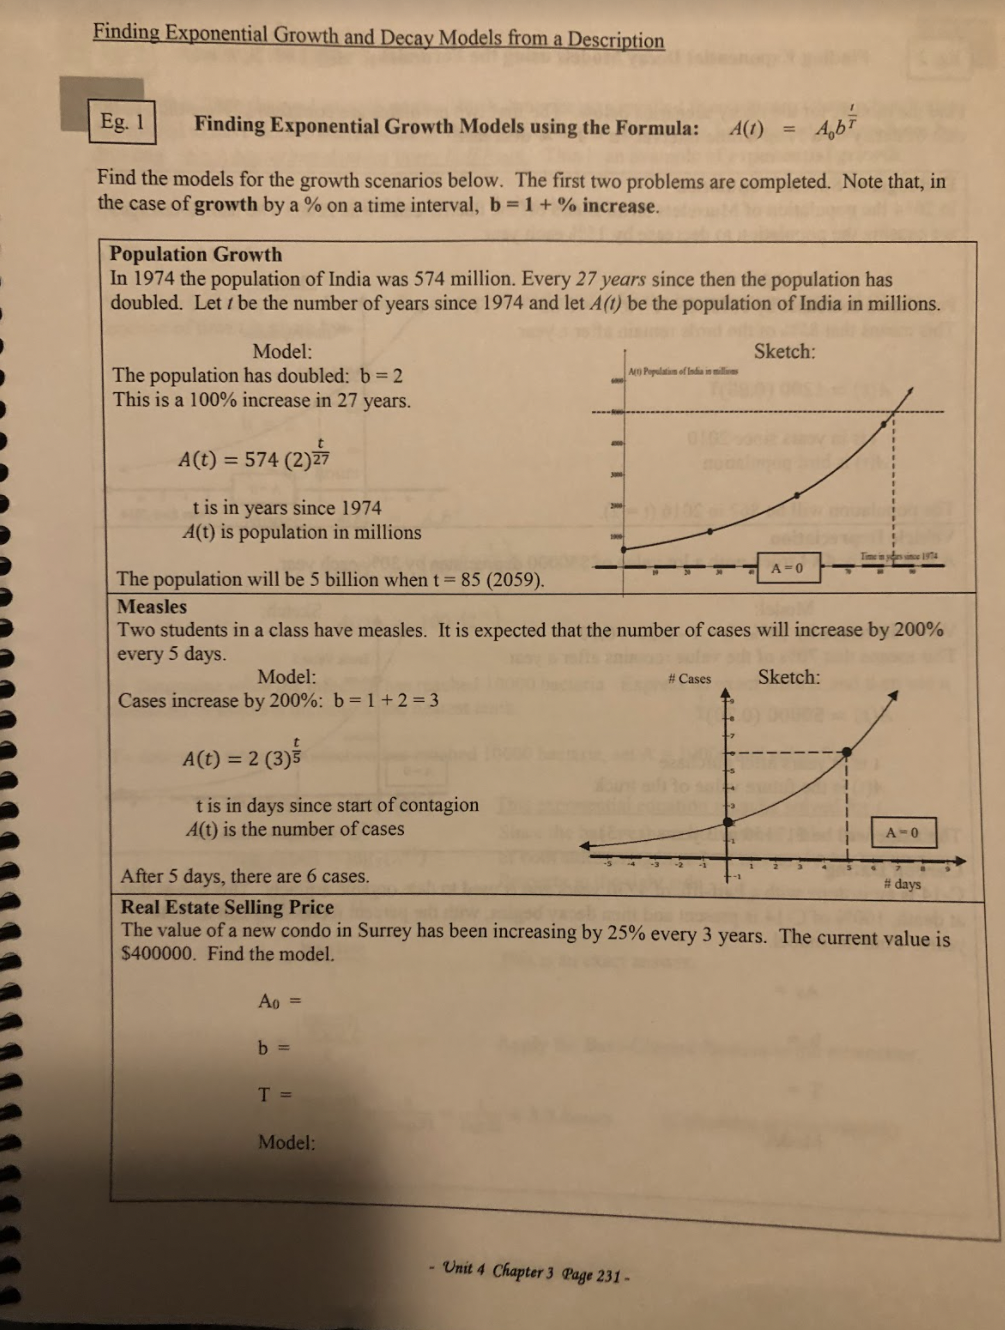
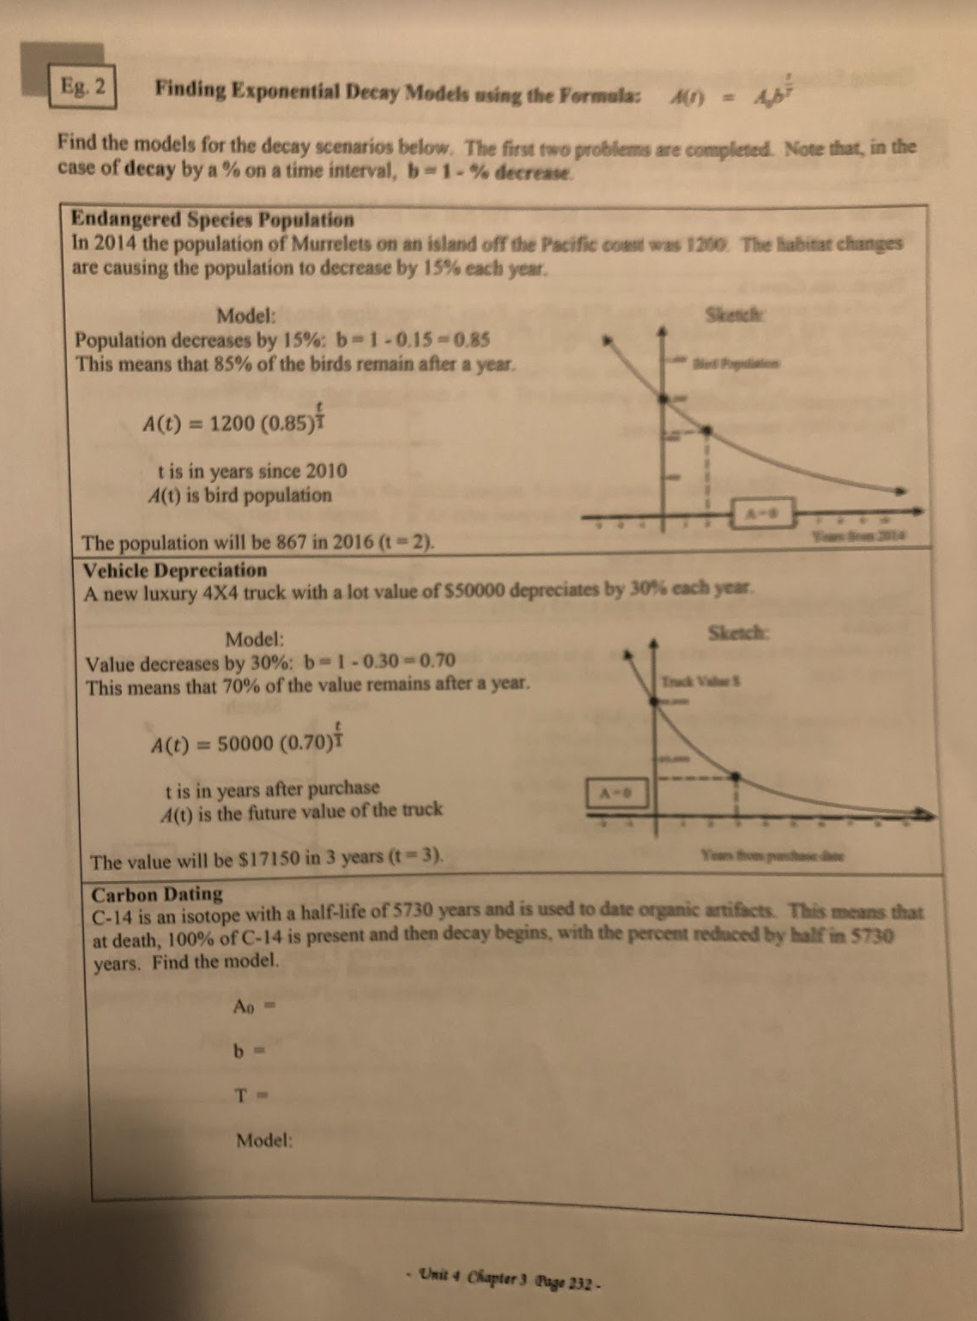
For each scenario below, find the matching basic growth or decay model, f(t). Refer to pages 230-232 in your text. - The concentration of pollutants in a lake is initially 100 ppm. The concentration A. f(t) = 100(1.5') decays by 40% every 3 years. The concentration of pollutants in a lake is initially 100 ppm. The concentration B. f(t) = 100(327) decays by 60% every 3 years. 100 bacteria begin a colony in a petri dish. The bacteria double every half hour. C. F(t) = 100(0.43 ) 100 bacteria begin a colony in a petri dish. The bacteria increase by 200% every half hour. The price of a bushel of specialty grain is currently $100. The price is increasing D. f (t) = 100(221 ) by 50% every year. - A large downtown office tower is currently valued at 100 million. The value is E. f(t) = 100(0.51) increasing at 5% every year. F. f (t) = 100(0.631) G. f (t) = 100(20.51) H. f(t) = 100 0.4 3 1. f(t) = 100 0.6 3 J. f(t) = 100(1.05 )Given the following exponential function, f(X)=16-[43"'] Fill in the blanks below: For each blank your answer should be submitted with no spaces between any characters. Coordinate points must be written with brackets and equations must be written correctly: y: ........ or x: ......... For the domain, signs must be used to specify -inf or +inf and appropriate brackets must be specified. The coordinates of the y-intercept is: The coordinates of the x-intercept is: The mathematical domain is: The equation of the horizontal asymptote is: :] II FINDING EXPONENTIAL AND LOGARITHMIC MODELS In this section, the objective is to become familiar with three common exponential and logarithmic models. They are shown in the boxes below. These formulas will be used to find logarithmic and exponential models from a description and from a data set. Common Exponential and Logarithmic Models A common growth and decay formula, shown below, can be used to model problems when the growth or decay rate , "b", is expressed as a unit increase or decrease in a value (doubling, tripling, by half, increase or decrease by a percent), in a particular time interval, "T". This formula assumes uninhibited growth or decay that approaches A = 0. The horizontal asymptote is A = 0. A (1 ) = Abt where A is the final amount, Ao is the initial amount, b is the growth or decay value, t is the time that has elapsed, 7 is the time interval of growth or decay. Another commonly used growth formula specifically for finance is the compound interest formula: A(1) = P( 1+") where A is the future value, P is the initial value or principle, r is the annual interest rate as a decimal t is the time in years n is the number of times the annual interest rate is compounded each year In this formula, the base of the exponential function depends on the interest rate and the number of times the interest rate is applied per year (number of compoundings). A common growth and decay formula, shown below, can be used to model problems when the growth or decay is inhibited by a horizontal asymptote at P = d. P(1) = aebt + d A common logarithmic formula is shown below P (t) = aln(t + b) + c or P(t) = alog(t + b)+ c - Unit 4 Chapter 3 Page 230 -Finding Exponential Growth and Decay Models from a Description Eg. 1 Finding Exponential Growth Models using the Formula: A(1) = AbT Find the models for the growth scenarios below. The first two problems are completed. Note that, in the case of growth by a % on a time interval, b = 1 + % increase. Population Growth In 1974 the population of India was 574 million. Every 27 years since then the population has doubled. Let / be the number of years since 1974 and let A(1) be the population of India in millions. Model: Sketch: The population has doubled: b = 2 All) Population of lafia in millines This is a 100% increase in 27 years. A(t) = 574 (2) 27 t is in years since 1974 A(t) is population in millions The population will be 5 billion when t = 85 (2059). A =0 Measles Two students in a class have measles. It is expected that the number of cases will increase by 200% every 5 days. Model: # Cases Sketch: Cases increase by 200%: b = 1 +2 =3 A (t ) = 2 (3) 5 t is in days since start of contagion A(t) is the number of cases A -0 After 5 days, there are 6 cases. # days Real Estate Selling Price The value of a new condo in Surrey has been increasing by 25% every 3 years. The current value is $400000. Find the model. Ao = b = T = Model: - Unit 4 Chapter 3 Page 231-Eg. 2 Finding Exponential Decay Models using the Formula: A() = Abt Find the models for the decay scenarios below. The first two problems are completed. Note that, in the case of decay by a % on a time interval, b - 1- % decrease. Endangered Species Population In 2014 the population of Murrelets on an island off the Pacific coast was 1200. The habitat changes are causing the population to decrease by 15% each year Model: Population decreases by 15% b= 1 - 0.15 -0.85 This means that 85% of the birds remain after a year. A(t) = 1200 (0.85)T t is in years since 2010 A(t) is bird population The population will be 867 in 2016 (t = 2). Vehicle Depreciation A new luxury 4X4 truck with a lot value of $50000 depreciates by 30% each year Model: Sketch Value decreases by 30%: b = 1 - 0.30 -0.70 This means that 70% of the value remains after a year. A(t) = 50000 (0.70)T t is in years after purchase A -0 A(t) is the future value of the truck The value will be $17150 in 3 years (t = 3). Carbon Dating C-14 is an isotope with a half-life of 5730 years and is used to date organic artifacts. This means that at death, 100% of C-14 is present and then decay begins, with the percent reduced by half in $730 years. Find the model. Ao b T - Model: - Unit 4 Chapter 3 Page 232
Step by Step Solution
There are 3 Steps involved in it
Step: 1
Get Instant Access to Expert-Tailored Solutions
See step-by-step solutions with expert insights and AI powered tools for academic success
Step: 2
Step: 3
Ace Your Homework with AI
Get the answers you need in no time with our AI-driven, step-by-step assistance