For each year, calculate the percentage change in:
Net Income
Comprehensive Income (Remember: Comp Inc = Net Income + Other Comp Income)
Operating Cash Flow
Using the percentage change for the Years 3, 4 and 5, calculate the standard deviation (assuming the population) for:
Net Income
Comprehensive Income
Operating Cash Flow
(Hint: make sure you know the difference between =stdev() and =stdevp() in excel.)
Round your answers to the nearest percentage point (e.g. 29.64983% should be entered as 30, not .30).
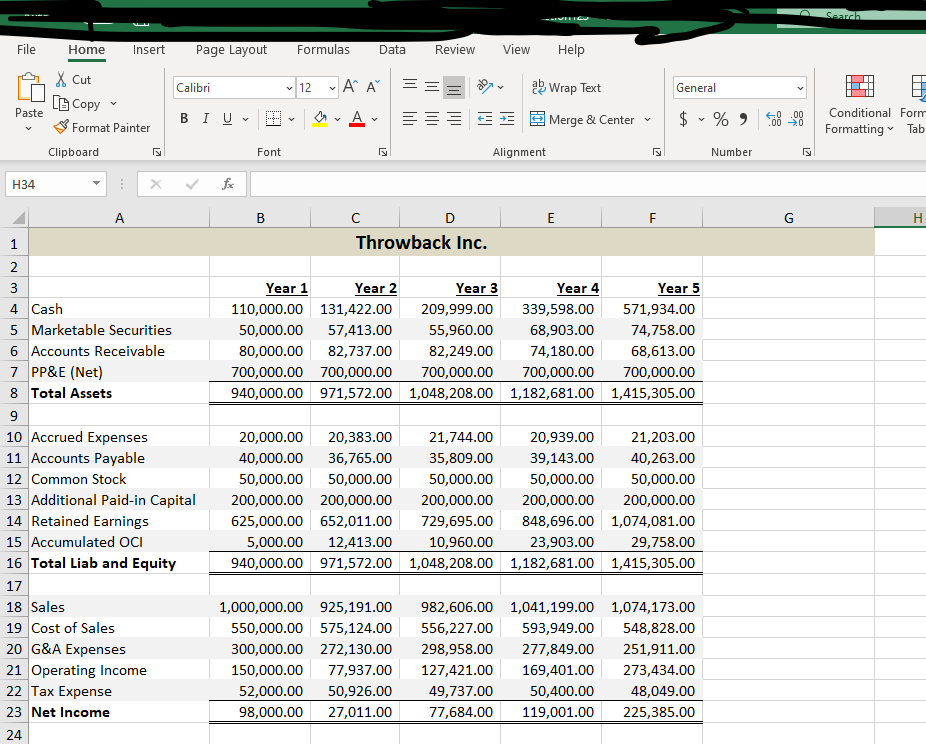
- Search File Home Insert Page Layout Formulas Data Review View Help A 12 General Calibri BIU - P AA - === xv E a Wrap Text 3 Merge & Center - Paste A $ 8-98 X Cut Lo Copy Format Painter Clipboard : * A % Number Conditional Form Formatting Tab Font Alignment 434 v for B E F G C D Throwback Inc. 4 Cash 5 Marketable Securities 6 Accounts Receivable 7 PP&E (Net) 8 Total Assets Year 1 110,000.00 50,000.00 80,000.00 700,000.00 940,000.00 Year 2 131,422.00 57,413.00 82,737.00 700,000.00 971,572.00 Year 3 209,999.00 55,960.00 82,249.00 700,000.00 1,048,208.00 Year 4 Year 5 339,598.00 571,934.00 68,903.00 74,758.00 74,180.00 68,613.00 700,000.00 700,000.00 1,182,681.00 1,415,305.00 20,000.00 40,000.00 50,000.00 200,000.00 625,000.00 5,000.00 940,000.00 20,383.00 36,765.00 50,000.00 200,000.00 652,011.00 12,413.00 971,572.00 21,744.00 35,809.00 50,000.00 200,000.00 729,695.00 10,960.00 1,048,208.00 20,939.00 39,143.00 50,000.00 200,000.00 848,696.00 23,903.00 1,182,681.00 21,203.00 40,263.00 50,000.00 200,000.00 1,074,081.00 29,758.00 1,415,305.00 10 Accrued Expenses 11 Accounts Payable 12 Common Stock 13 Additional Paid-in Capital 14 Retained Earnings 15 Accumulated OCI 16 Total Liab and Equity 17 18 Sales 19 Cost of Sales 20 G&A Expenses 21 Operating Income 22 Tax Expense 23 Net Income 1.000.000.00 925,191.00 550,000.00 575,124.00 300,000.00 272,130.00 150,000.00 77,937.00 52,000.00 50,926.00 98,000.00 27,011.00 982,606.00 556,227.00 298,958.00 127,421.00 49,737.00 77,684.00 1,041,199.00 593,949.00 277,849.00 169,401.00 50,400.00 119,001.00 1,074,173.00 548,828.00 251,911.00 273,434.00 48,049.00 225,385.00 24 - Search File Home Insert Page Layout Formulas Data Review View Help A 12 General Calibri BIU - P AA - === xv E a Wrap Text 3 Merge & Center - Paste A $ 8-98 X Cut Lo Copy Format Painter Clipboard : * A % Number Conditional Form Formatting Tab Font Alignment 434 v for B E F G C D Throwback Inc. 4 Cash 5 Marketable Securities 6 Accounts Receivable 7 PP&E (Net) 8 Total Assets Year 1 110,000.00 50,000.00 80,000.00 700,000.00 940,000.00 Year 2 131,422.00 57,413.00 82,737.00 700,000.00 971,572.00 Year 3 209,999.00 55,960.00 82,249.00 700,000.00 1,048,208.00 Year 4 Year 5 339,598.00 571,934.00 68,903.00 74,758.00 74,180.00 68,613.00 700,000.00 700,000.00 1,182,681.00 1,415,305.00 20,000.00 40,000.00 50,000.00 200,000.00 625,000.00 5,000.00 940,000.00 20,383.00 36,765.00 50,000.00 200,000.00 652,011.00 12,413.00 971,572.00 21,744.00 35,809.00 50,000.00 200,000.00 729,695.00 10,960.00 1,048,208.00 20,939.00 39,143.00 50,000.00 200,000.00 848,696.00 23,903.00 1,182,681.00 21,203.00 40,263.00 50,000.00 200,000.00 1,074,081.00 29,758.00 1,415,305.00 10 Accrued Expenses 11 Accounts Payable 12 Common Stock 13 Additional Paid-in Capital 14 Retained Earnings 15 Accumulated OCI 16 Total Liab and Equity 17 18 Sales 19 Cost of Sales 20 G&A Expenses 21 Operating Income 22 Tax Expense 23 Net Income 1.000.000.00 925,191.00 550,000.00 575,124.00 300,000.00 272,130.00 150,000.00 77,937.00 52,000.00 50,926.00 98,000.00 27,011.00 982,606.00 556,227.00 298,958.00 127,421.00 49,737.00 77,684.00 1,041,199.00 593,949.00 277,849.00 169,401.00 50,400.00 119,001.00 1,074,173.00 548,828.00 251,911.00 273,434.00 48,049.00 225,385.00 24