Question
For estimating Company Cs required return on equity, you used the capital asset pricing model (CAPM) approach; but you think its own equity beta of
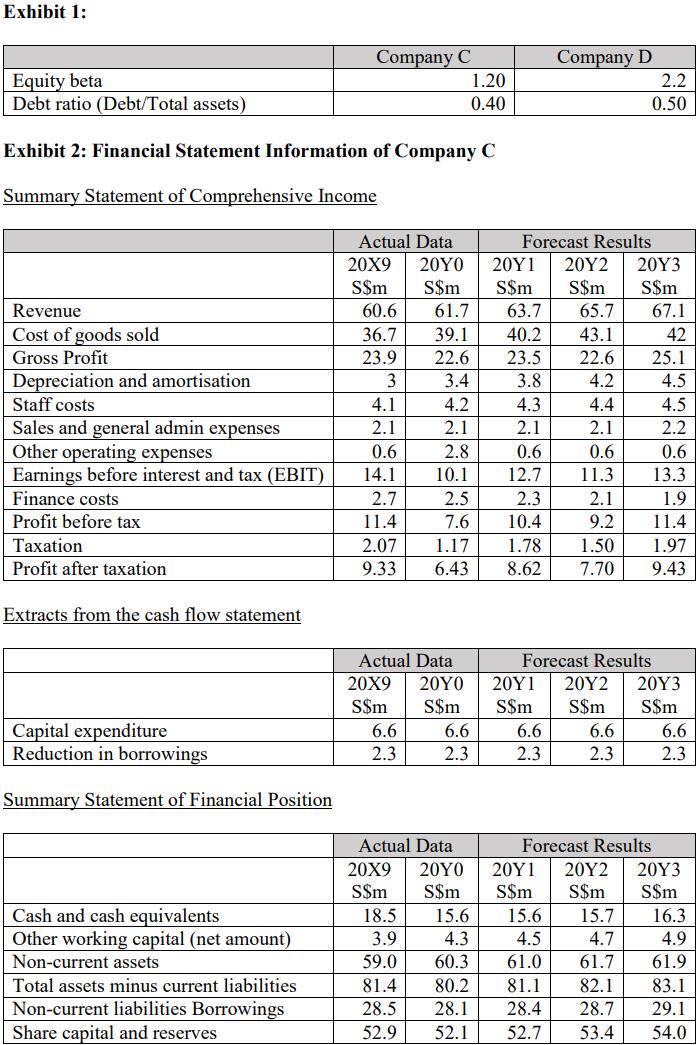
For estimating Company C’s required return on equity, you used the capital asset pricing model (CAPM) approach; but you think its own equity beta of 1.20 is not very reliable because of the stock’s extremely thin trading volume. Therefore, you obtain the beta and other pertinent data for Company D (see Exhibit 1), a midsized company in the same industry with high market liquidity trading on the same stock exchange, and re-levers it to reflect Company C’s financial leverage.
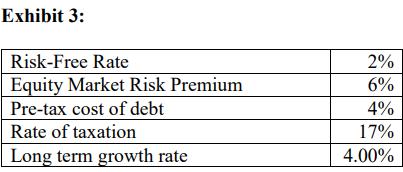
You decided to estimate the value of Company C by using the discounted cash flow method. The summary financial data of Company C and other required information are in Exhibit 2 and Exhibit 3, respectively.
QUESTION: Using the information provided on Company D, calculate an estimate of Company C’s beta and weighted average cost of capital (WACC) using the estimate you obtained of the beta. Show all workings.


Exhibit 1: Equity beta Debt ratio (Debt/Total assets) Exhibit 2: Financial Statement Information of Company C Summary Statement of Comprehensive Income Revenue Cost of goods sold Gross Profit Depreciation and amortisation Staff costs Sales and general admin expenses Other operating expenses Earnings before interest and tax (EBIT) Finance costs Profit before tax Taxation Profit after taxation Extracts from the cash flow statement Capital expenditure Reduction in borrowings Summary Statement of Financial Position Cash and cash equivalents Other working capital (net amount) Company C Non-current assets Total assets minus current liabilities Non-current liabilities Borrowings Share capital and reserves 60.6 36.7 23.9 3 4.1 2.1 0.6 14.1 Actual Data Forecast Results 20X9 20Y0 20Y1 20Y2 20Y3 S$m S$m S$m S$m S$m 61.7 63.7 65.7 67.1 39.1 40.2 43.1 42 22.6 23.5 22.6 25.1 3.4 3.8 4.2 4.5 4.3 4.4 4.5 2.1 2.1 0.6 0.6 12.7 11.3 2.7 11.4 2.07 9.33 6.6 2.3 4.2 2.1 2.8 10.1 Actual Data 20X9 20Y0 S$m S$m 20X9 S$m 1.20 0.40 Actual Data 6.6 2.3 Company D 2.5 2.3 1.9 7.6 10.4 11.4 1.17 1.78 1.50 1.97 6.43 8.62 7.70 9.43 6.6 2.3 2.1 9.2 18.5 3.9 59.0 81.4 28.5 28.1 52.9 52.1 52.7 2.2 0.50 6.6 2.3 Forecast Results 20Y1 20Y2 20Y3 S$m S$m S$m 20Y0 S$m S$m S$m 15.6 15.6 15.7 4.3 4.5 4.7 60.3 61.0 61.7 80.2 81.1 82.1 28.4 28.7 53.4 2.2 0.6 13.3 Forecast Results 20Y1 20Y2 20Y3 S$m 6.6 2.3 16.3 4.9 61.9 83.1 29.1 54.0
Step by Step Solution
There are 3 Steps involved in it
Step: 1
To estimate Company Cs beta and weighted average cost of capital WACC using the information provided ...
Get Instant Access to Expert-Tailored Solutions
See step-by-step solutions with expert insights and AI powered tools for academic success
Step: 2

Step: 3

Ace Your Homework with AI
Get the answers you need in no time with our AI-driven, step-by-step assistance
Get Started


