For excel VBA and answer Please only question 8 and 9 .Thanks.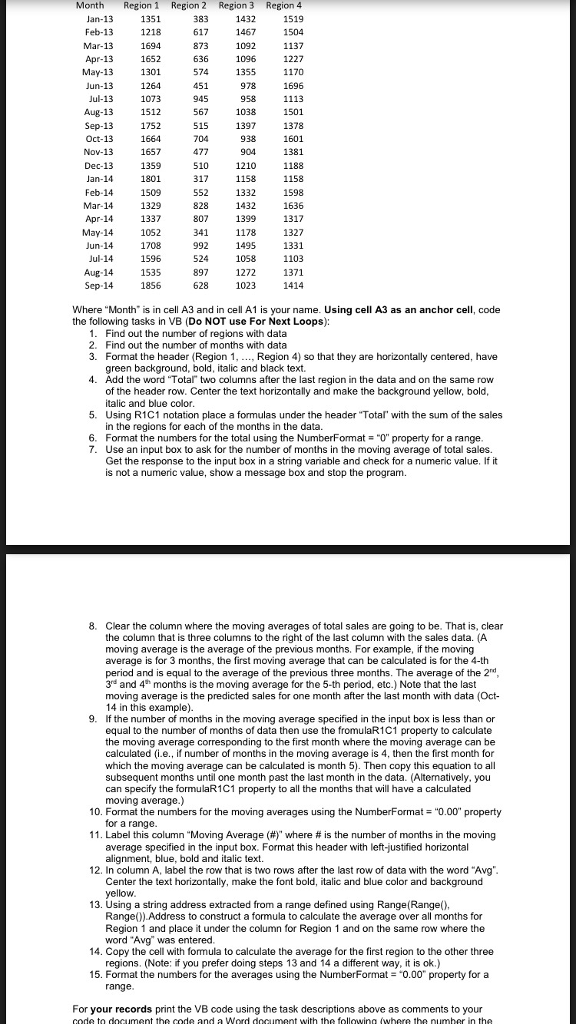
Where "Month" is in cell A3 and n cell A1 is your name. Using cell A3 as an anchor cell, code the following tasks in VB (Do NOT use For Next Loops) 1. Find out the number of regions with data 2. Find out the number of months with data 3. Format the header (Region 1, ..., Region 4) so that they are horizontally centered, have green background, bold, italic and black text. 4. Add the word "Total" two column after the last region in the data and on the same row of the header roe. Center the text horizontally and make the background yellow. bold, italic and blue color. 5. Using R1C1 notation place a formulas under the header "Total" with the sum of the sales in the regions for each of the months in the data. 6. Format the numbers for the total using the NumberFormatat = "0" property for a range 7. Use an input box to ask for the number of months in the moving average of total sales. Get the response to the input box in a string variable and check for a numeric value. If it is not a numeric value, show a message box and stop the program. 8. Clear the column where the moving averages of total sales are going to be. That is, clear the column that is three columns to the right of the last column with the sales data. (A moving average is the average of the previous months. For example, if the moving average is for 3 months, the first moving average that can be calculated is for the 4-th period and is equal to the average of the previous three months. The average of the 2^nd, 3^rd, and 4^th months is the moving average for the 5-th period, etc.) Note that the last moving average is the predicted sales for one month after the last month with data (Oct 14 in this example). 9. If the number of months in the moving average specified in the input box is less than or equal to the number of months of data then use the fromulaR1C1 property to calculate the moving average corresponding to the first month where the moving average can be calculated (i e., if number of months in the moving average is 4, then the first month which the moving average can be calculated is month 5). Then copy this equation to all subsequent months until one month past the last month in the data. (Alternatively, you can specify the formulaR1C1 property to all the months that will have a calculated moving average). 10. Format the numbers for the moving averages using the NumberFormat = "0.00" property for a range. 11. Label this column "Moving Average(#)" where # is the number of months in the moving average specified in the input box. Format this header with left-justified horizontal alignment blue, bold and italic text. 12. In column A, label the row that is two rows after the last row of data with the word "Avg" Center the text horizontally, make the font bold, italic and blue color and background yellow. 13. Using a string address extracted from a range defined using Range(Range(), Range()). Address to construct a formula to calculate the average over all months for Region 1 and place it under the column for Region 1 and on the same row where the word "Avg" was entered 14. Copy the cell with formula to calculate the average for the first region to the other three regions. 15. Format the numbers for the averages using the NumberFormat = "0.00" property for a range. Where "Month" is in cell A3 and n cell A1 is your name. Using cell A3 as an anchor cell, code the following tasks in VB (Do NOT use For Next Loops) 1. Find out the number of regions with data 2. Find out the number of months with data 3. Format the header (Region 1, ..., Region 4) so that they are horizontally centered, have green background, bold, italic and black text. 4. Add the word "Total" two column after the last region in the data and on the same row of the header roe. Center the text horizontally and make the background yellow. bold, italic and blue color. 5. Using R1C1 notation place a formulas under the header "Total" with the sum of the sales in the regions for each of the months in the data. 6. Format the numbers for the total using the NumberFormatat = "0" property for a range 7. Use an input box to ask for the number of months in the moving average of total sales. Get the response to the input box in a string variable and check for a numeric value. If it is not a numeric value, show a message box and stop the program. 8. Clear the column where the moving averages of total sales are going to be. That is, clear the column that is three columns to the right of the last column with the sales data. (A moving average is the average of the previous months. For example, if the moving average is for 3 months, the first moving average that can be calculated is for the 4-th period and is equal to the average of the previous three months. The average of the 2^nd, 3^rd, and 4^th months is the moving average for the 5-th period, etc.) Note that the last moving average is the predicted sales for one month after the last month with data (Oct 14 in this example). 9. If the number of months in the moving average specified in the input box is less than or equal to the number of months of data then use the fromulaR1C1 property to calculate the moving average corresponding to the first month where the moving average can be calculated (i e., if number of months in the moving average is 4, then the first month which the moving average can be calculated is month 5). Then copy this equation to all subsequent months until one month past the last month in the data. (Alternatively, you can specify the formulaR1C1 property to all the months that will have a calculated moving average). 10. Format the numbers for the moving averages using the NumberFormat = "0.00" property for a range. 11. Label this column "Moving Average(#)" where # is the number of months in the moving average specified in the input box. Format this header with left-justified horizontal alignment blue, bold and italic text. 12. In column A, label the row that is two rows after the last row of data with the word "Avg" Center the text horizontally, make the font bold, italic and blue color and background yellow. 13. Using a string address extracted from a range defined using Range(Range(), Range()). Address to construct a formula to calculate the average over all months for Region 1 and place it under the column for Region 1 and on the same row where the word "Avg" was entered 14. Copy the cell with formula to calculate the average for the first region to the other three regions. 15. Format the numbers for the averages using the NumberFormat = "0.00" property for a range