For full marks, show all calculations, steps, and/or explain your answers. 1. U2 is an Irish band that has been popular for over three decades.
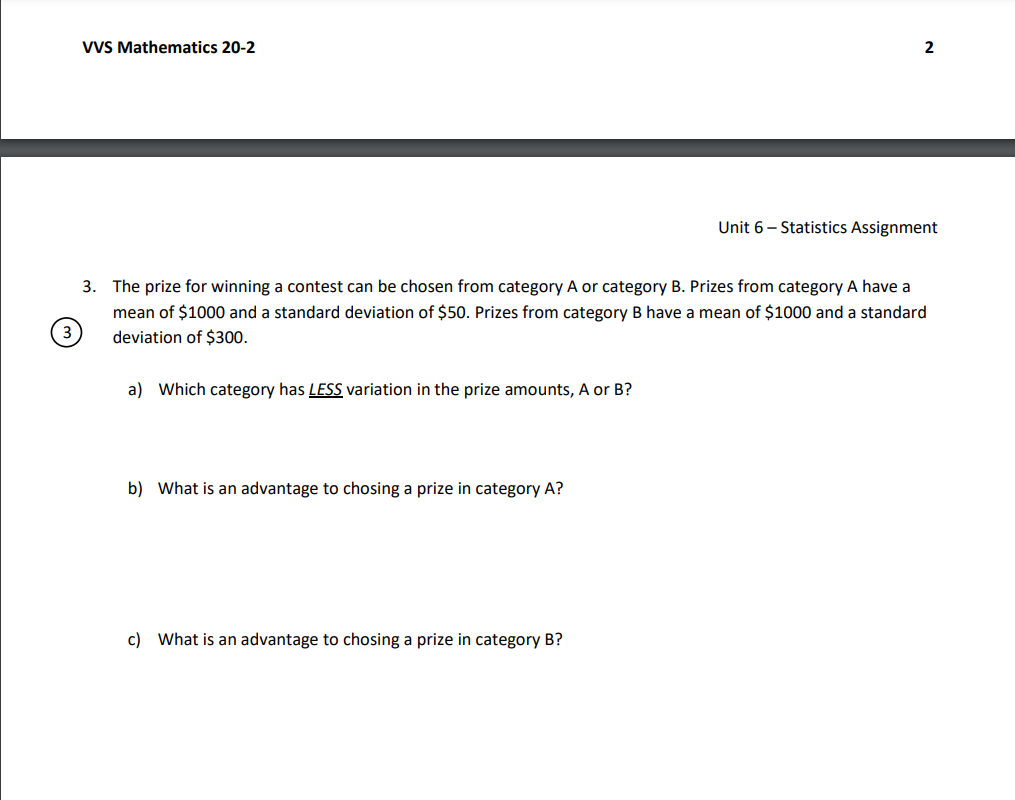
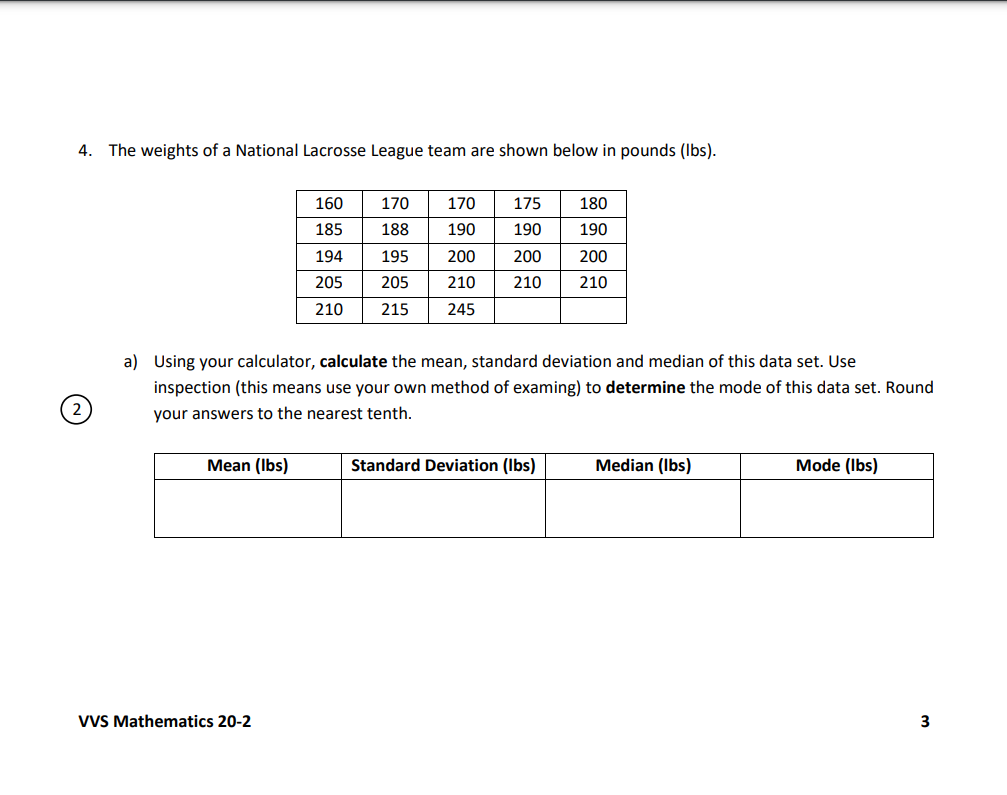
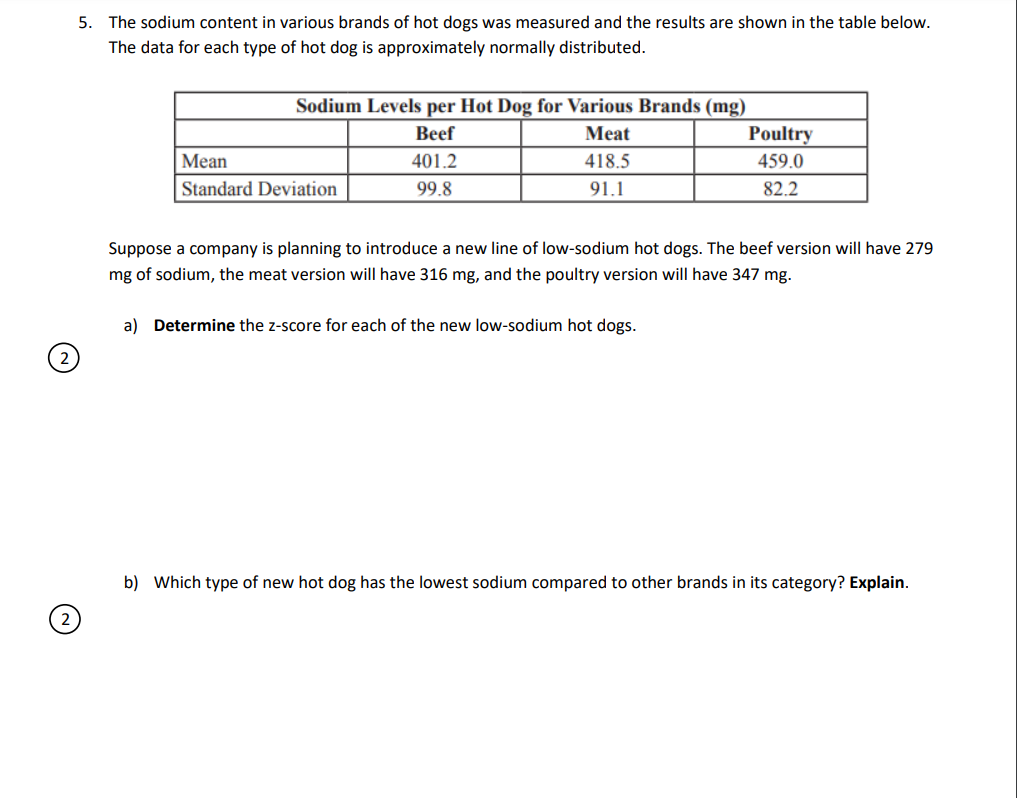
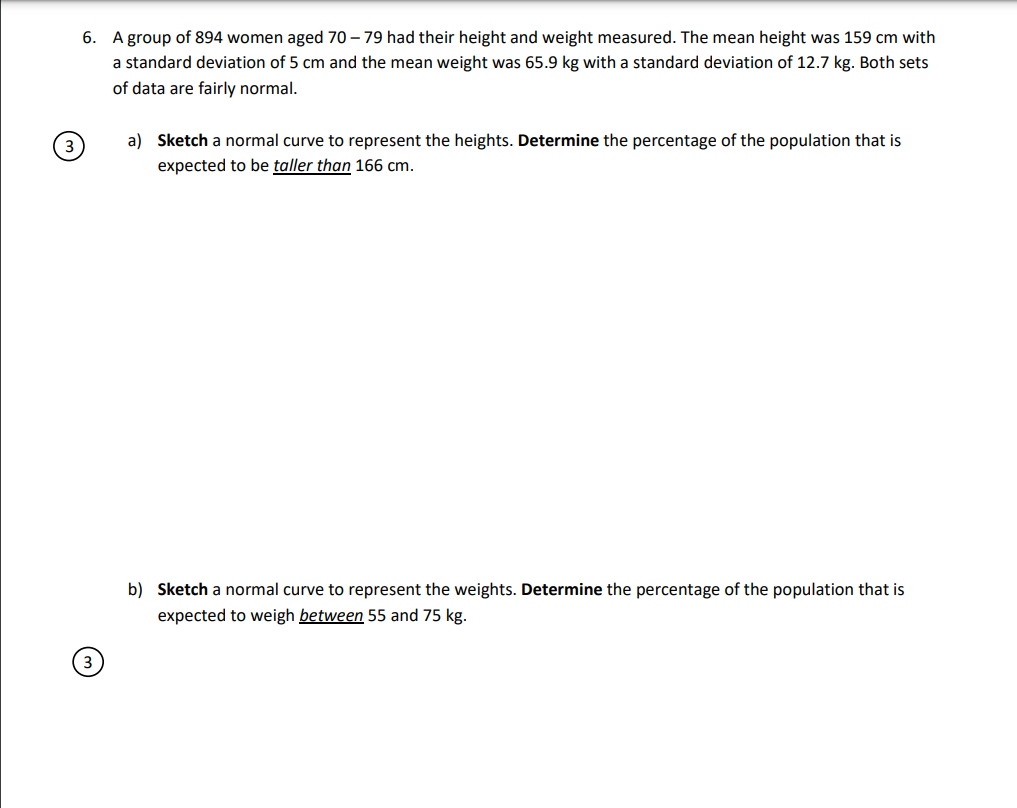
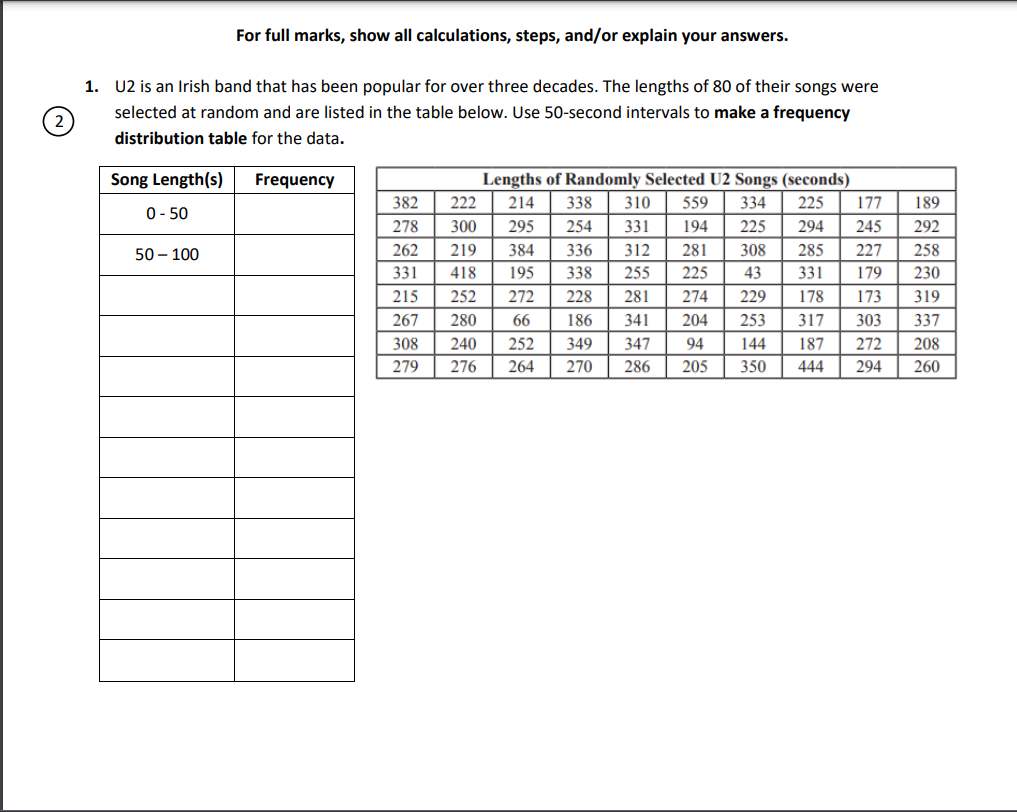
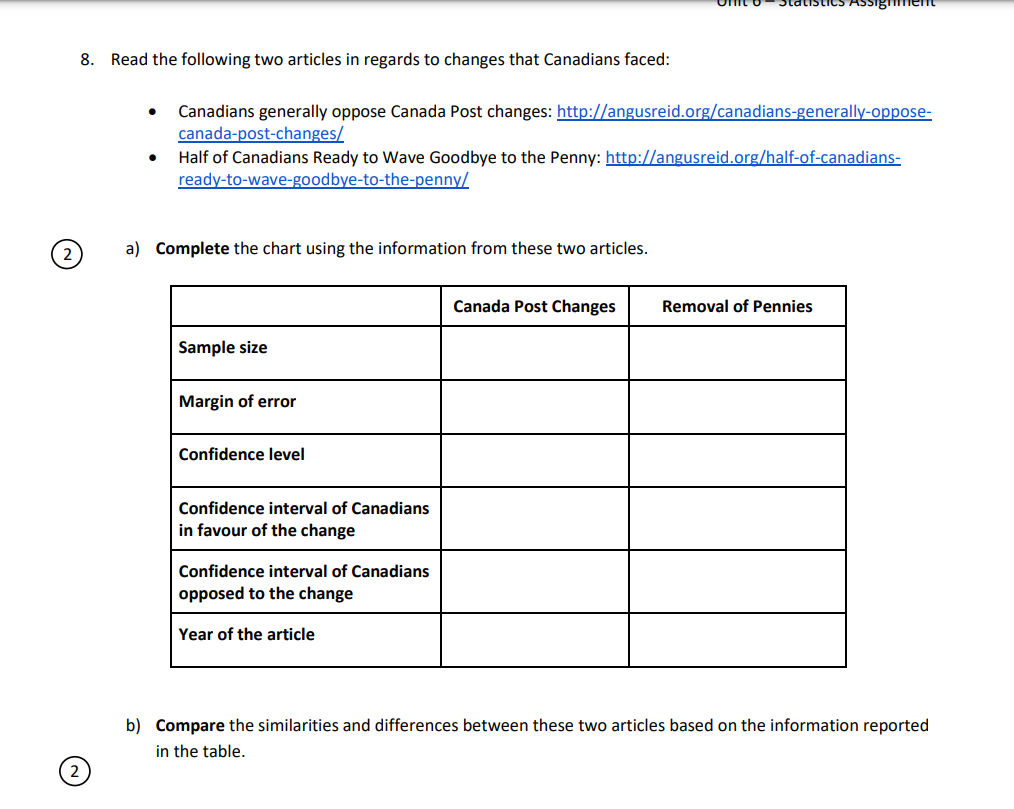
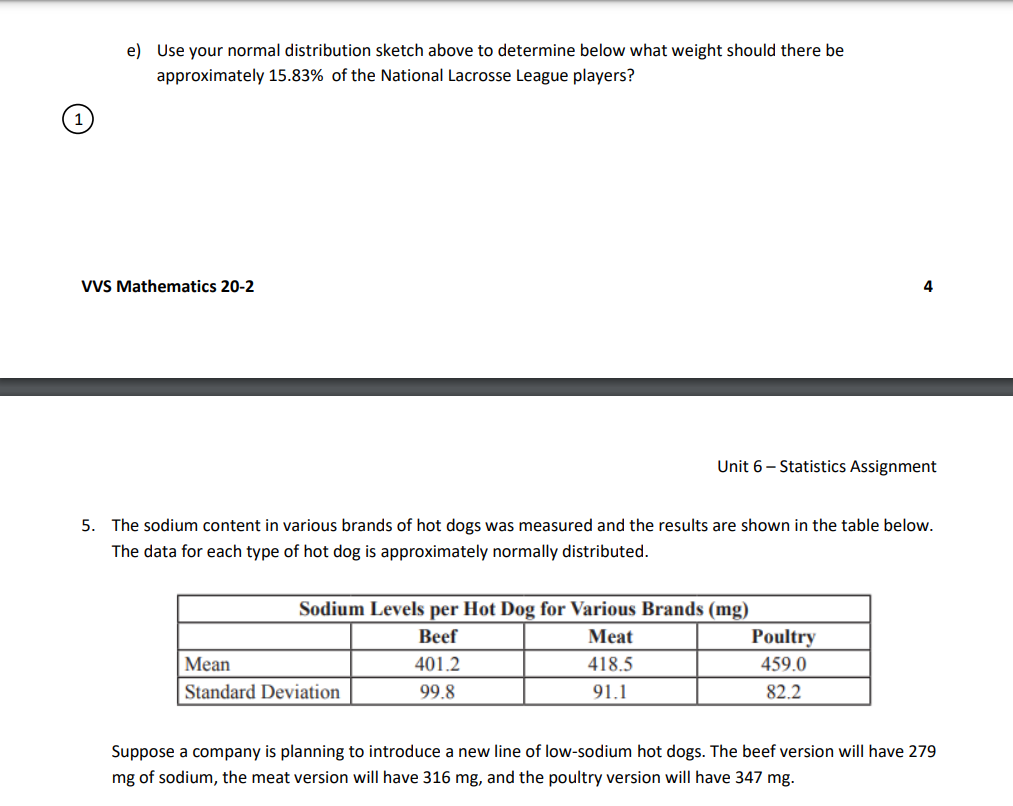
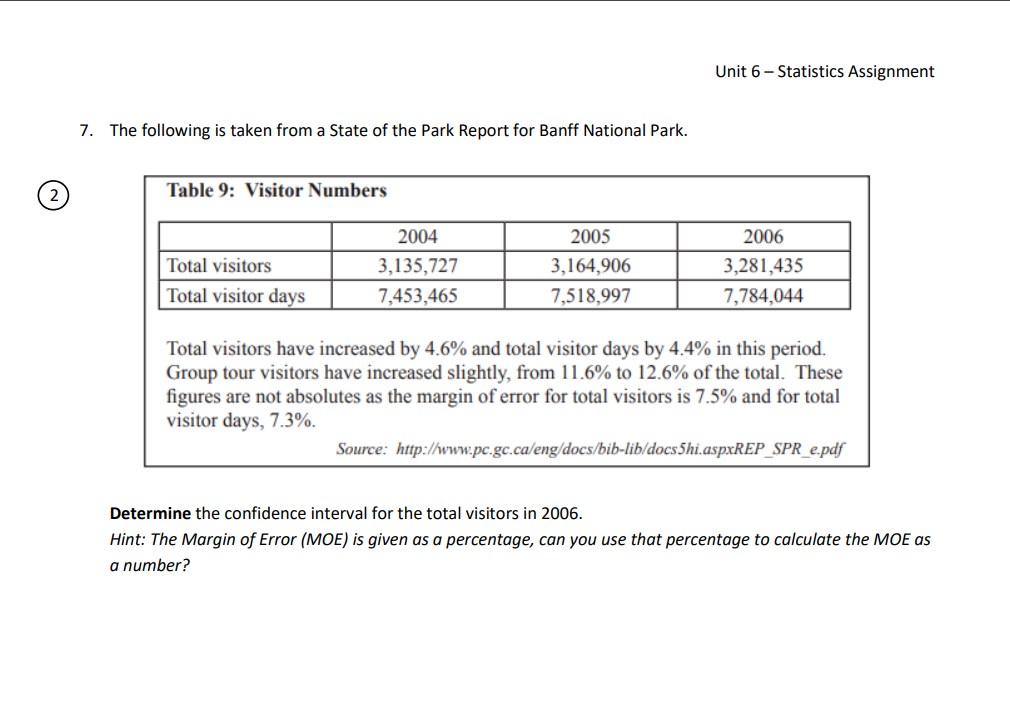
For full marks, show all calculations, steps, and/or explain your answers. 1. U2 is an Irish band that has been popular for over three decades. The lengths of 80 of their songs were 2 selected at random and are listed in the table below. Use 50-second intervals to make a frequency distribution table for the data. Song Length(s) Frequency Lengths of Randomly Selected U2 Songs (seconds) 0 - 50 382 222 214 338 310 559 334 225 177 189 278 300 295 254 331 194 225 294 245 292 50 - 100 262 219 384 336 312 281 308 285 227 258 331 418 195 338 255 225 43 331 179 230 215 252 272 228 281 274 229 178 173 319 267 280 66 186 341 204 253 317 303 337 308 240 252 349 347 94 144 187 272 208 279 276 264 270 286 205 350 444 294 2608. Read the following two articles in regards to changes that Canadians faced: Canadians generally oppose Canada Post changes: http://angusreid.org/canadians-generally-oppose- canada-post-changes/ . Half of Canadians Ready to Wave Goodbye to the Penny: http://angusreid.org/half-of-canadians- ready-to-wave-goodbye-to-the-penny/ 2 a) Complete the chart using the information from these two articles. Canada Post Changes Removal of Pennies Sample size Margin of error Confidence level Confidence interval of Canadians in favour of the change Confidence interval of Canadians opposed to the change Year of the article b) Compare the similarities and differences between these two articles based on the information reported in the table. 2Unit 6 Statistics Assignment 2. Use your frequency distribution table to draw a histogram for the data. Remember a histogram is a graph so it should include the following: 0 Labels on the axes. 0 An appropriate and consistent scale. o A name or title. W5 Mathematics 20-2 2 Unit 6 Statistics Assignment 3. The prize for winning a contest can be chosen from category A or category B. Prizes from category A have a mean ofSlDUO and a standard deviation of $50. Prizes from category B have a mean of$1000 and a standard deviation of $300. a} Which category has LE5; variation in the prize amounts, A or B? b) What is an advantage to chosing a prize in category A? c} What is an advantage to chosing a prize in category B? 4. The weights of a National Lacrosse League team are shown below in pounds {lbs}. 160 170 170 17 5 180 185 183 190 190 190 194 195 200 200 200 205 205 210 2 10 2 10 2 10 2 15 245 3) Using your calculator, calculate the mean, standard deviation and median of this data set. Use inspection [this means use your own method of examing] to determine the mode of this data set. Round your answers to the nearest tenth. Standard Deviation {lbs} Median {lbs} Mode [lbs] W5 Mathematics 20-2 3 b} Based on the above calculations and the characteristics of a Normal Distribution. provide a justication for why is close to being normally distributed. c] Draw a normal curve that represents this data. (D d) Assume that the mean and standard deviation of this lacrosse team are the same as the mean and standard deviation for th entire National Lacrosse League. If there are 213 players in the league, use (9 your normal distribution sketch above to calculate the approximate number of players that weigh over 231.3 lbs. e] Use your normal distribution sketch above to determine below what weight should there be approximately 15.83% of the National Lacrosse League players? 6) W5 Mathematics 20-2 4 Unit 6 Statistics Assignment 5. The sodium content in various brands of hot clogs was measured and the results are shown in the table below. The data for each type of hot dog is approximately normally distributed. Sodium Levels per Hot Dog for Various Brands (mg) m mm\" Standard Deviation m- Suppose a company is planning to introduce a new line of low-sodium hot dogs. The beef version will have 279 mg of sodium, the meat version will have 316 mg, and the poultry version will have 347 mg. 5. The sodium content in various brands of hot dogs was measured and the results are shown in the table below. The data for each type of hot dog is approximately normally distributed. Sodium Levels per Hot Dog for Various Brands (mg) m mm:- 418-5 459-0 Standard Deviation -n--sz- Suppose a company is planning to introduce a new line of low-sodium hot dogs. The beef version will have 279 mg of sodium, the meat version will have 316 mg, and the poultry version will have 347 mg. a) Determine the z-score for each of the new low-sodium hot dogs. (9 b} Which type of new hot dog has the lowest sodium compared to other brands in its category? Explain. 6. A group of 894 women aged 70 79 had their height and weight measured. The mean height was 159 cm with a standard deviation of 5 cm and the mean weight was 65.9 kg with a standard deviation of 12.7 kg. Both sets of data are fairly normal. 6) a] Sketch a normal curve to represent the heights. Determine the percentage of the population that is expected to be taller than 166 cm. b] Sketch a normal curve to represent the weights. Determine the percentage of the population that is expected to weigh gtwggn 55 and 75 kg. 6) Unit 6 Statistics Assignment 7. The following is taken from a State of the Park Report for Banff National Park. Table 9: Visitor Numbers m_ 3.135172? 3,231,435 7,453,465 1513997 7,734,044 Total visitors have increased by 4.6% and total visitor days by 4.4% in this period. Group tour visitors have increased slightly, from 11.6% to 12.6% of the total. These gures are not absolutes as the margin of error for total visitors is 7.5% and for total visitor days, 7.3%. Source: bupsffnwmpagc.Meng/docnbibb/docbtaspxREP_SPR_e.M Determine the condence interval for the total visitors in 2006. Hint: The Margin of Error (MOE) is given as a percentage, can you use that percentage to calculate the MOE as a number
Step by Step Solution
There are 3 Steps involved in it
Step: 1
Get Instant Access to Expert-Tailored Solutions
See step-by-step solutions with expert insights and AI powered tools for academic success
Step: 2
Step: 3
Ace Your Homework with AI
Get the answers you need in no time with our AI-driven, step-by-step assistance