

Question: For FY2001, the equity report forecasts a 6% earnings growth and a P/B ratio of 1.38. Is the P/B consistent with the earnings growth forecast?
For FY2001, the equity report forecasts a 6% earnings growth and a P/B ratio of 1.38. Is the P/B consistent with the earnings growth forecast? What is the implied growth rate of residual income from the market price?
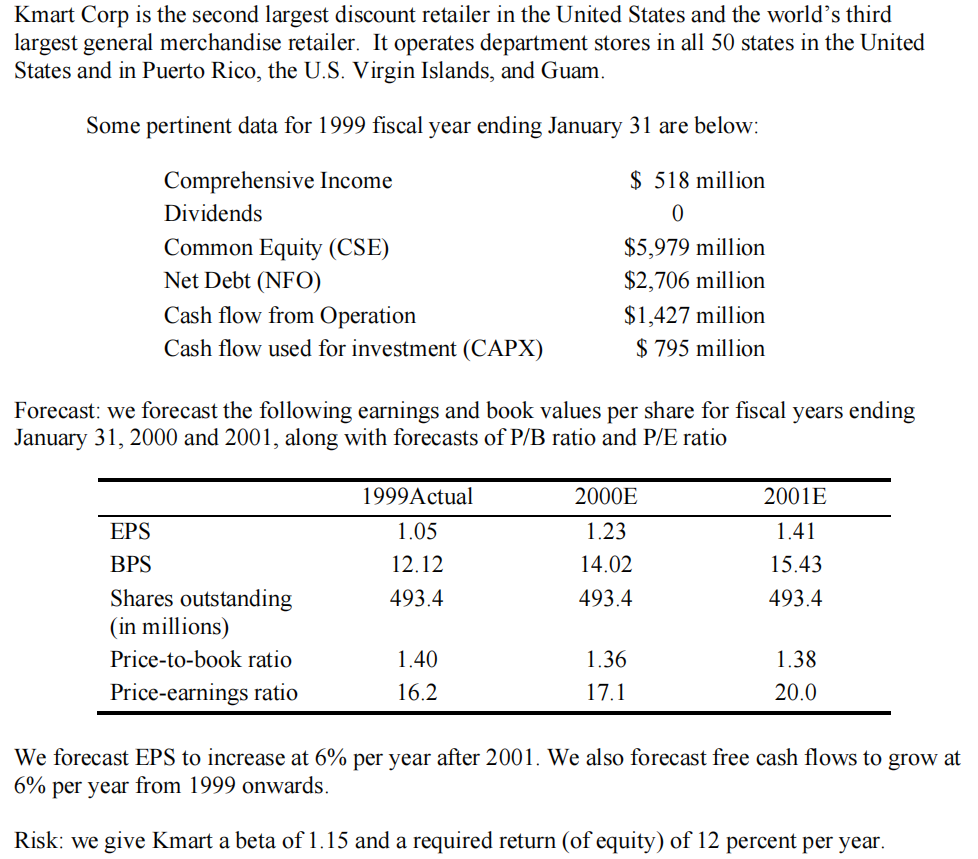
Kmart Corp is the second largest discount retailer in the United States and the world's third largest general merchandise retailer. It operates department stores in all 50 states in the United States and in Puerto Rico, the U.S. Virgin Islands, and Guam. Some pertinent data for 1999 fiscal year ending January 31 are below: Comprehensive Income $ 518 million Dividends 0 $5,979 million Common Equity (CSE) Net Debt (NFO) $2,706 million $1,427 million $ 795 million Cash flow from Operation Cash flow used for investment (CAPX) Forecast: we forecast the following earnings and book values per share for fiscal years ending January 31, 2000 and 2001, along with forecasts of P/B ratio and P/E ratio EPS BPS Shares outstanding (in millions) Price-to-book ratio Price-earnings ratio 1999 Actual 1.05 12.12 493.4 1.40 16.2 2000E 1.23 14.02 493.4 1.36 17.1 2001E 1.41 15.43 493.4 1.38 20.0 We forecast EPS to increase at 6% per year after 2001. We also forecast free cash flows to grow at 6% per year from 1999 onwards. Risk: we give Kmart a beta of 1.15 and a required return (of equity) of 12 percent per year. Kmart Corp is the second largest discount retailer in the United States and the world's third largest general merchandise retailer. It operates department stores in all 50 states in the United States and in Puerto Rico, the U.S. Virgin Islands, and Guam. Some pertinent data for 1999 fiscal year ending January 31 are below: Comprehensive Income $ 518 million Dividends 0 $5,979 million Common Equity (CSE) Net Debt (NFO) $2,706 million $1,427 million $ 795 million Cash flow from Operation Cash flow used for investment (CAPX) Forecast: we forecast the following earnings and book values per share for fiscal years ending January 31, 2000 and 2001, along with forecasts of P/B ratio and P/E ratio EPS BPS Shares outstanding (in millions) Price-to-book ratio Price-earnings ratio 1999 Actual 1.05 12.12 493.4 1.40 16.2 2000E 1.23 14.02 493.4 1.36 17.1 2001E 1.41 15.43 493.4 1.38 20.0 We forecast EPS to increase at 6% per year after 2001. We also forecast free cash flows to grow at 6% per year from 1999 onwards. Risk: we give Kmart a beta of 1.15 and a required return (of equity) of 12 percent per year
Step by Step Solution
There are 3 Steps involved in it

Get step-by-step solutions from verified subject matter experts