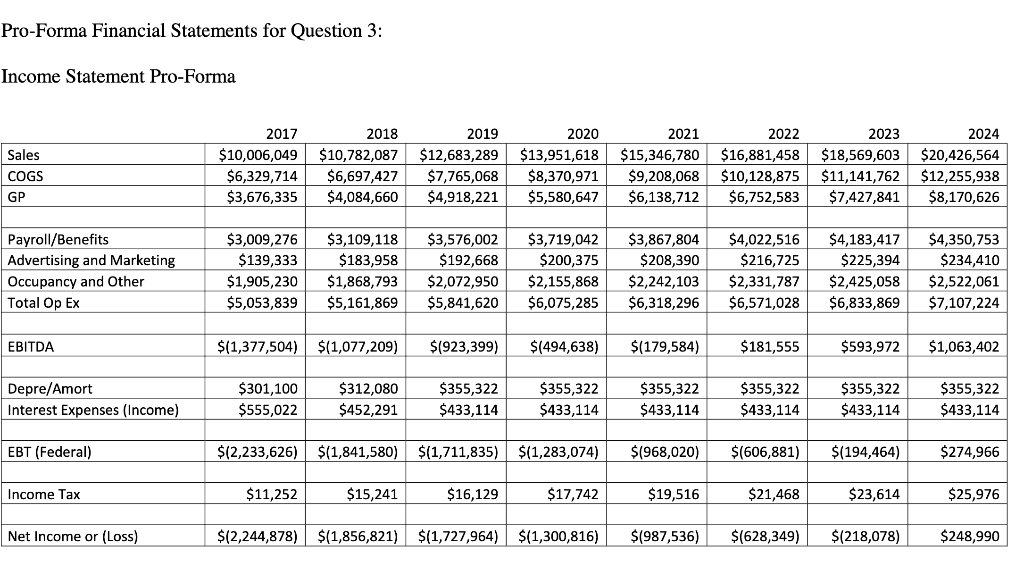
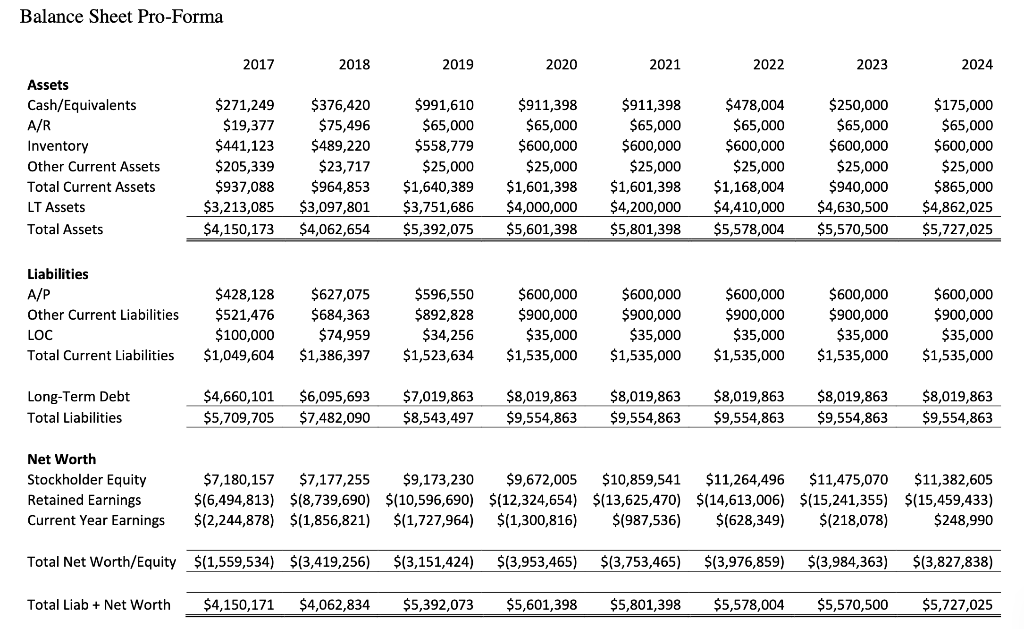
For Green Zebra using the case study from class: Calculate Green Zebras valuation using the attached, pro-forma financial statements and the Weighted Average Cost of Capital (WACC) Valuation Method as of the end of fiscal year 2020

Pro-Forma Financial Statements for Question 3: Income Statement Pro-Forma Sales COGS GP 2017 $10,006,049 $6,329,714 $3,676,335 2018 $10,782,087 $6,697,427 $4,084,660 2019 $12,683,289 $7,765,068 $4,918,221 2020 $13,951,618 $8,370,971 $5,580,647 2021 $15,346,780 $9,208,068 $6,138,712 2022 $16,881,458 $10,128,875 $6,752,583 2023 $18,569,603 $11,141,762 $7,427,841 2024 $20,426,564 $12,255,938 $8,170,626 Payroll/Benefits Advertising and Marketing Occupancy and Other Total Op Ex $3,009,276 $139,333 $1,905,230 $5,053,839 $3,109,118 $183,958 $1,868,793 $5,161,869 $3,576,002 $192,668 $2,072,950 $5,841,620 $3,719,042 $200,375 $2,155,868 $6,075,285 $3,867,804 $208,390 $2,242,103 $6,318,296 $4,022,516 $216,725 $2,331,787 $6,571,028 $4,183,417 $225,394 $2,425,058 $6,833,869 $4,350,753 $234,410 $2,522,061 $7,107,224 EBITDA $(1,377,504) $(1,077,209) $(923,399) $(494,638) $(179,584) $181,555 $593,972 $1,063,402 Depre/Amort Interest Expenses (Income) $301,100 $555,022 $312,080 $452,291 $355,322 $433,114 $355,322 $433,114 $355,322 $433,114 $355,322 $433,114 $355,322 $433,114 $355,322 $433,114 EBT (Federal) $(2,233,626) $(1,841,580) $(1,711,835) $(1,283,074) $(968,020) $(606,881) $(194,464) $274,966 Income Tax $11,252 $15,241 $16,129 $17,742 $19,516 $21,468 $23,614 $25,976 Net Income or (Loss) $12,244,878) $(1,856,821) $(1,727,964) $(1,300,816) $(987,536) $(628,349) $(218,078) $248,990 Balance Sheet Pro-Forma 2017 2018 2019 2020 2021 2022 2023 2024 Assets Cash/Equivalents A/R Inventory Other Current Assets Total Current Assets LT Assets Total Assets $271,249 $19,377 $441,123 $205,339 $937,088 $3,213,085 $4,150,173 $376,420 $75,496 $489,220 $23,717 $964,853 $3,097,801 $4,062,654 $991,610 $65,000 $558,779 $25,000 $1,640,389 $3,751,686 $5,392,075 $911,398 $65,000 $600,000 $25,000 $1,601,398 $4,000,000 $5,601,398 $911,398 $65,000 $600,000 $25,000 $1,601,398 $4,200,000 $5,801,398 $478,004 $65,000 $600,000 $25,000 $1,168,004 $4,410,000 $5,578,004 $250,000 $65,000 $600,000 $25,000 $940,000 $4,630,500 $5,570,500 $175,000 $65,000 $600,000 $25,000 $865,000 $4,862,025 $5,727,025 Liabilities A/P Other Current Liabilities LOC Total Current Liabilities $428,128 $521,476 $100,000 $1,049,604 $627,075 $684,363 $74,959 $1,386,397 $596,550 $892,828 $34,256 $1,523,634 $600,000 $900,000 $35,000 $1,535,000 $600,000 $900,000 $35,000 $1,535,000 $600,000 $900,000 $35,000 $1,535,000 $600,000 $900,000 $35,000 $1,535,000 $600,000 $900,000 $35,000 $1,535,000 Long-Term Debt Total Liabilities $4,660,101 $5,709,705 $6,095,693 $7,482,090 $7,019,863 $8,543,497 $8,019,863 $9,554,863 $8,019,863 $9,554,863 $8,019,863 $9,554,863 $8,019,863 $9,554,863 $8,019,863 $9,554,863 Net Worth Stockholder Equity Retained Earnings Current Year Earnings $7,180,157 $7,177,255 $9,173,230 $9,672,005 $10,859,541 $11,264,496 $11,475,070 $11,382,605 $(6,494,813) $(8,739,690) $(10,596,690) $(12,324,654) $(13,625,470) $(14,613,006) $(15,241,355) $(15,459,433) $12,244,878) $(1,856,821) $(1,727,964) $(1,300,816) $(987,536) $(628,349) $(218,078) $248,990 Total Net Worth/Equity $(1,559,534) $(3,419,256) $(3,151,424) $13,953,465) $(3,753,465) $(3,976,859) $(3,984,363) $(3,827,838) Total Liab + Net Worth $4,150,171 $4,062,834 $5,392,073 $5,601,398 $5,801,398 $5,578,004 $5,570,500 $5,727,025 Pro-Forma Financial Statements for Question 3: Income Statement Pro-Forma Sales COGS GP 2017 $10,006,049 $6,329,714 $3,676,335 2018 $10,782,087 $6,697,427 $4,084,660 2019 $12,683,289 $7,765,068 $4,918,221 2020 $13,951,618 $8,370,971 $5,580,647 2021 $15,346,780 $9,208,068 $6,138,712 2022 $16,881,458 $10,128,875 $6,752,583 2023 $18,569,603 $11,141,762 $7,427,841 2024 $20,426,564 $12,255,938 $8,170,626 Payroll/Benefits Advertising and Marketing Occupancy and Other Total Op Ex $3,009,276 $139,333 $1,905,230 $5,053,839 $3,109,118 $183,958 $1,868,793 $5,161,869 $3,576,002 $192,668 $2,072,950 $5,841,620 $3,719,042 $200,375 $2,155,868 $6,075,285 $3,867,804 $208,390 $2,242,103 $6,318,296 $4,022,516 $216,725 $2,331,787 $6,571,028 $4,183,417 $225,394 $2,425,058 $6,833,869 $4,350,753 $234,410 $2,522,061 $7,107,224 EBITDA $(1,377,504) $(1,077,209) $(923,399) $(494,638) $(179,584) $181,555 $593,972 $1,063,402 Depre/Amort Interest Expenses (Income) $301,100 $555,022 $312,080 $452,291 $355,322 $433,114 $355,322 $433,114 $355,322 $433,114 $355,322 $433,114 $355,322 $433,114 $355,322 $433,114 EBT (Federal) $(2,233,626) $(1,841,580) $(1,711,835) $(1,283,074) $(968,020) $(606,881) $(194,464) $274,966 Income Tax $11,252 $15,241 $16,129 $17,742 $19,516 $21,468 $23,614 $25,976 Net Income or (Loss) $12,244,878) $(1,856,821) $(1,727,964) $(1,300,816) $(987,536) $(628,349) $(218,078) $248,990 Balance Sheet Pro-Forma 2017 2018 2019 2020 2021 2022 2023 2024 Assets Cash/Equivalents A/R Inventory Other Current Assets Total Current Assets LT Assets Total Assets $271,249 $19,377 $441,123 $205,339 $937,088 $3,213,085 $4,150,173 $376,420 $75,496 $489,220 $23,717 $964,853 $3,097,801 $4,062,654 $991,610 $65,000 $558,779 $25,000 $1,640,389 $3,751,686 $5,392,075 $911,398 $65,000 $600,000 $25,000 $1,601,398 $4,000,000 $5,601,398 $911,398 $65,000 $600,000 $25,000 $1,601,398 $4,200,000 $5,801,398 $478,004 $65,000 $600,000 $25,000 $1,168,004 $4,410,000 $5,578,004 $250,000 $65,000 $600,000 $25,000 $940,000 $4,630,500 $5,570,500 $175,000 $65,000 $600,000 $25,000 $865,000 $4,862,025 $5,727,025 Liabilities A/P Other Current Liabilities LOC Total Current Liabilities $428,128 $521,476 $100,000 $1,049,604 $627,075 $684,363 $74,959 $1,386,397 $596,550 $892,828 $34,256 $1,523,634 $600,000 $900,000 $35,000 $1,535,000 $600,000 $900,000 $35,000 $1,535,000 $600,000 $900,000 $35,000 $1,535,000 $600,000 $900,000 $35,000 $1,535,000 $600,000 $900,000 $35,000 $1,535,000 Long-Term Debt Total Liabilities $4,660,101 $5,709,705 $6,095,693 $7,482,090 $7,019,863 $8,543,497 $8,019,863 $9,554,863 $8,019,863 $9,554,863 $8,019,863 $9,554,863 $8,019,863 $9,554,863 $8,019,863 $9,554,863 Net Worth Stockholder Equity Retained Earnings Current Year Earnings $7,180,157 $7,177,255 $9,173,230 $9,672,005 $10,859,541 $11,264,496 $11,475,070 $11,382,605 $(6,494,813) $(8,739,690) $(10,596,690) $(12,324,654) $(13,625,470) $(14,613,006) $(15,241,355) $(15,459,433) $12,244,878) $(1,856,821) $(1,727,964) $(1,300,816) $(987,536) $(628,349) $(218,078) $248,990 Total Net Worth/Equity $(1,559,534) $(3,419,256) $(3,151,424) $13,953,465) $(3,753,465) $(3,976,859) $(3,984,363) $(3,827,838) Total Liab + Net Worth $4,150,171 $4,062,834 $5,392,073 $5,601,398 $5,801,398 $5,578,004 $5,570,500 $5,727,025


