

Answered step by step
Verified Expert Solution
Question
1 Approved Answer
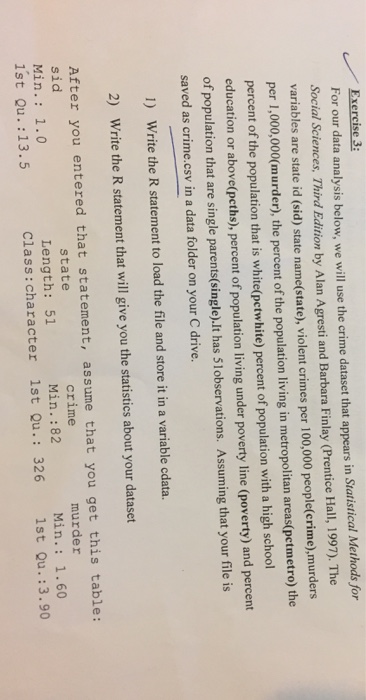
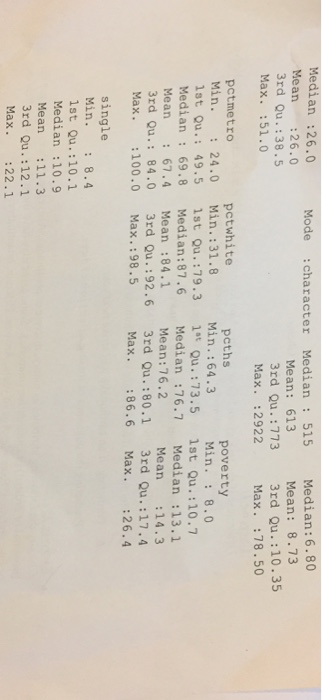
For our data analysis below, we will use the crime dataset that appears in Statistical Methods for Social Sciences, Third Edition by Alan Agresti and
Step by Step Solution
There are 3 Steps involved in it
Step: 1

Get Instant Access to Expert-Tailored Solutions
See step-by-step solutions with expert insights and AI powered tools for academic success
Step: 2

Step: 3
Ace Your Homework with AI
Get the answers you need in no time with our AI-driven, step-by-step assistance
Get Started
Advanced Oracle Solaris 11 System Administration
Authors: Bill Calkins
1st Edition
0133007170, 9780133007176