For part C and D Please put your answers on XL, and how you plugged it in on XL. thanks
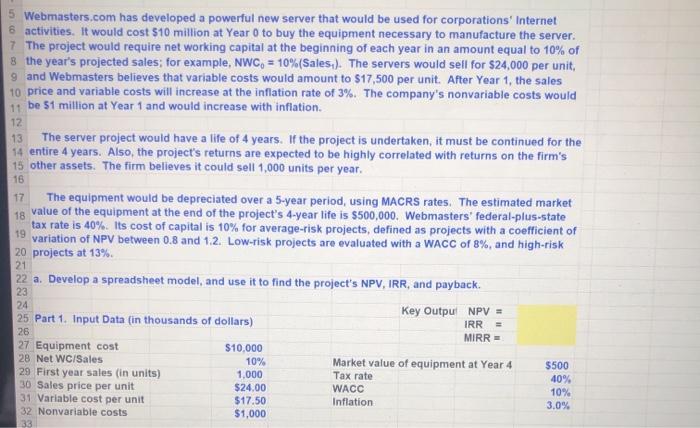
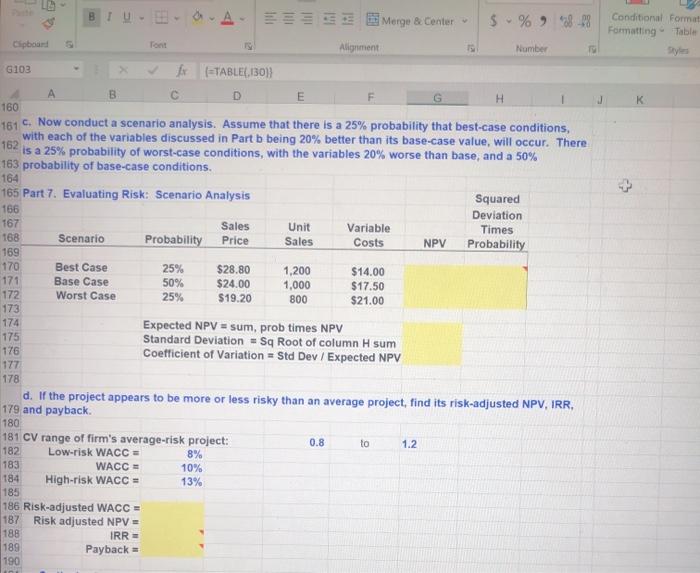
12 13 5 Webmasters.com has developed a powerful new server that would be used for corporations Internet 6 activities. It would cost $10 million at Year 0 to buy the equipment necessary to manufacture the server. 7 The project would require net working capital at the beginning of each year in an amount equal to 10% of 8 the year's projected sales; for example, NWC= 10%(Sales.). The servers would sell for $24,000 per unit, 9 and Webmasters believes that variable costs would amount to $17,500 per unit. After Year 1, the sales 10 price and variable costs will increase at the inflation rate of 3%. The company's nonvariable costs would 11 be 51 million at Year 1 and would increase with inflation. The server project would have a life of 4 years. If the project is undertaken, it must be continued for the 14 entire 4 years. Also, the project's returns are expected to be highly correlated with returns on the firm's 15 other assets. The firm believes it could sell 1,000 units per year. 16 17 The equipment would be depreciated over a 5-year period, using MACRS rates. The estimated market 18 value of the equipment at the end of the project's 4-year life is $500,000. Webmasters' federal-plus-state tax rate is 40%. Its cost of capital is 10% for average-risk projects, defined as projects with a coefficient of variation of NPV between 0.8 and 1.2. Low-risk projects are evaluated with a WACC of 8%, and high-risk 20 projects at 13% 22 a. Develop a spreadsheet model, and use it to find the project's NPV, IRR, and payback 23 Key Output NPV = 25 Part 1. Input Data (in thousands of dollars) MIRR - 27 Equipment cost $10,000 28 Net WC/Sales 10% Market value of equipment at Year 4 $500 29 First year sales (in units) 1,000 40% 30 Sales price per unit $24.00 WACC 10% 31 Variable cost per unit Inflation 32 Nonvariable costs $1,000 19 21 24 IRR 26 Tax rate $17.50 3.0% 33 Conditional Format Formatting Table G K 162 Merge & Center $ % al 88 Clipboard Tont Alignment Number 6103 ETABLE,130) D E H 160 161 c. Now conduct a scenario analysis. Assume that there is a 25% probability that best-case conditions, with each of the variables discussed in Part b being 20% better than its base-case value, will occur. There is a 25% probability of worst-case conditions, with the variables 20% worse than base, and a 50% 163 probability of base-case conditions. 164 165 Part 7. Evaluating Risk: Scenario Analysis Squared 166 Deviation 167 Sales Unit Variable Times 168 Scenario Probability Price Sales Costs NPV Probability 169 170 Best Case 25% $28.80 1,200 $14.00 171 Base Case 50% $24.00 1,000 $17.50 172 Worst Case 25% $19.20 800 $21.00 173 174 Expected NPV = sum, prob times NPV 175 Standard Deviation - Sq Root of column H sum 176 Coefficient of Variation - Std Dev / Expected NPV 177 178 d. If the project appears to be more or less risky than an average project, find its risk-adjusted NPV, IRR. 179 and payback 180 181 CV range of firm's average-risk project: 0.8 to 1.2 182 Low-risk WACC = 8% 183 WACC = 10% 184 High-risk WACC = 13% 185 186 Risk-adjusted WACC = 187 Risk adjusted NPV = 188 IRR = 189 Payback = 190 12 13 5 Webmasters.com has developed a powerful new server that would be used for corporations Internet 6 activities. It would cost $10 million at Year 0 to buy the equipment necessary to manufacture the server. 7 The project would require net working capital at the beginning of each year in an amount equal to 10% of 8 the year's projected sales; for example, NWC= 10%(Sales.). The servers would sell for $24,000 per unit, 9 and Webmasters believes that variable costs would amount to $17,500 per unit. After Year 1, the sales 10 price and variable costs will increase at the inflation rate of 3%. The company's nonvariable costs would 11 be 51 million at Year 1 and would increase with inflation. The server project would have a life of 4 years. If the project is undertaken, it must be continued for the 14 entire 4 years. Also, the project's returns are expected to be highly correlated with returns on the firm's 15 other assets. The firm believes it could sell 1,000 units per year. 16 17 The equipment would be depreciated over a 5-year period, using MACRS rates. The estimated market 18 value of the equipment at the end of the project's 4-year life is $500,000. Webmasters' federal-plus-state tax rate is 40%. Its cost of capital is 10% for average-risk projects, defined as projects with a coefficient of variation of NPV between 0.8 and 1.2. Low-risk projects are evaluated with a WACC of 8%, and high-risk 20 projects at 13% 22 a. Develop a spreadsheet model, and use it to find the project's NPV, IRR, and payback 23 Key Output NPV = 25 Part 1. Input Data (in thousands of dollars) MIRR - 27 Equipment cost $10,000 28 Net WC/Sales 10% Market value of equipment at Year 4 $500 29 First year sales (in units) 1,000 40% 30 Sales price per unit $24.00 WACC 10% 31 Variable cost per unit Inflation 32 Nonvariable costs $1,000 19 21 24 IRR 26 Tax rate $17.50 3.0% 33 Conditional Format Formatting Table G K 162 Merge & Center $ % al 88 Clipboard Tont Alignment Number 6103 ETABLE,130) D E H 160 161 c. Now conduct a scenario analysis. Assume that there is a 25% probability that best-case conditions, with each of the variables discussed in Part b being 20% better than its base-case value, will occur. There is a 25% probability of worst-case conditions, with the variables 20% worse than base, and a 50% 163 probability of base-case conditions. 164 165 Part 7. Evaluating Risk: Scenario Analysis Squared 166 Deviation 167 Sales Unit Variable Times 168 Scenario Probability Price Sales Costs NPV Probability 169 170 Best Case 25% $28.80 1,200 $14.00 171 Base Case 50% $24.00 1,000 $17.50 172 Worst Case 25% $19.20 800 $21.00 173 174 Expected NPV = sum, prob times NPV 175 Standard Deviation - Sq Root of column H sum 176 Coefficient of Variation - Std Dev / Expected NPV 177 178 d. If the project appears to be more or less risky than an average project, find its risk-adjusted NPV, IRR. 179 and payback 180 181 CV range of firm's average-risk project: 0.8 to 1.2 182 Low-risk WACC = 8% 183 WACC = 10% 184 High-risk WACC = 13% 185 186 Risk-adjusted WACC = 187 Risk adjusted NPV = 188 IRR = 189 Payback = 190