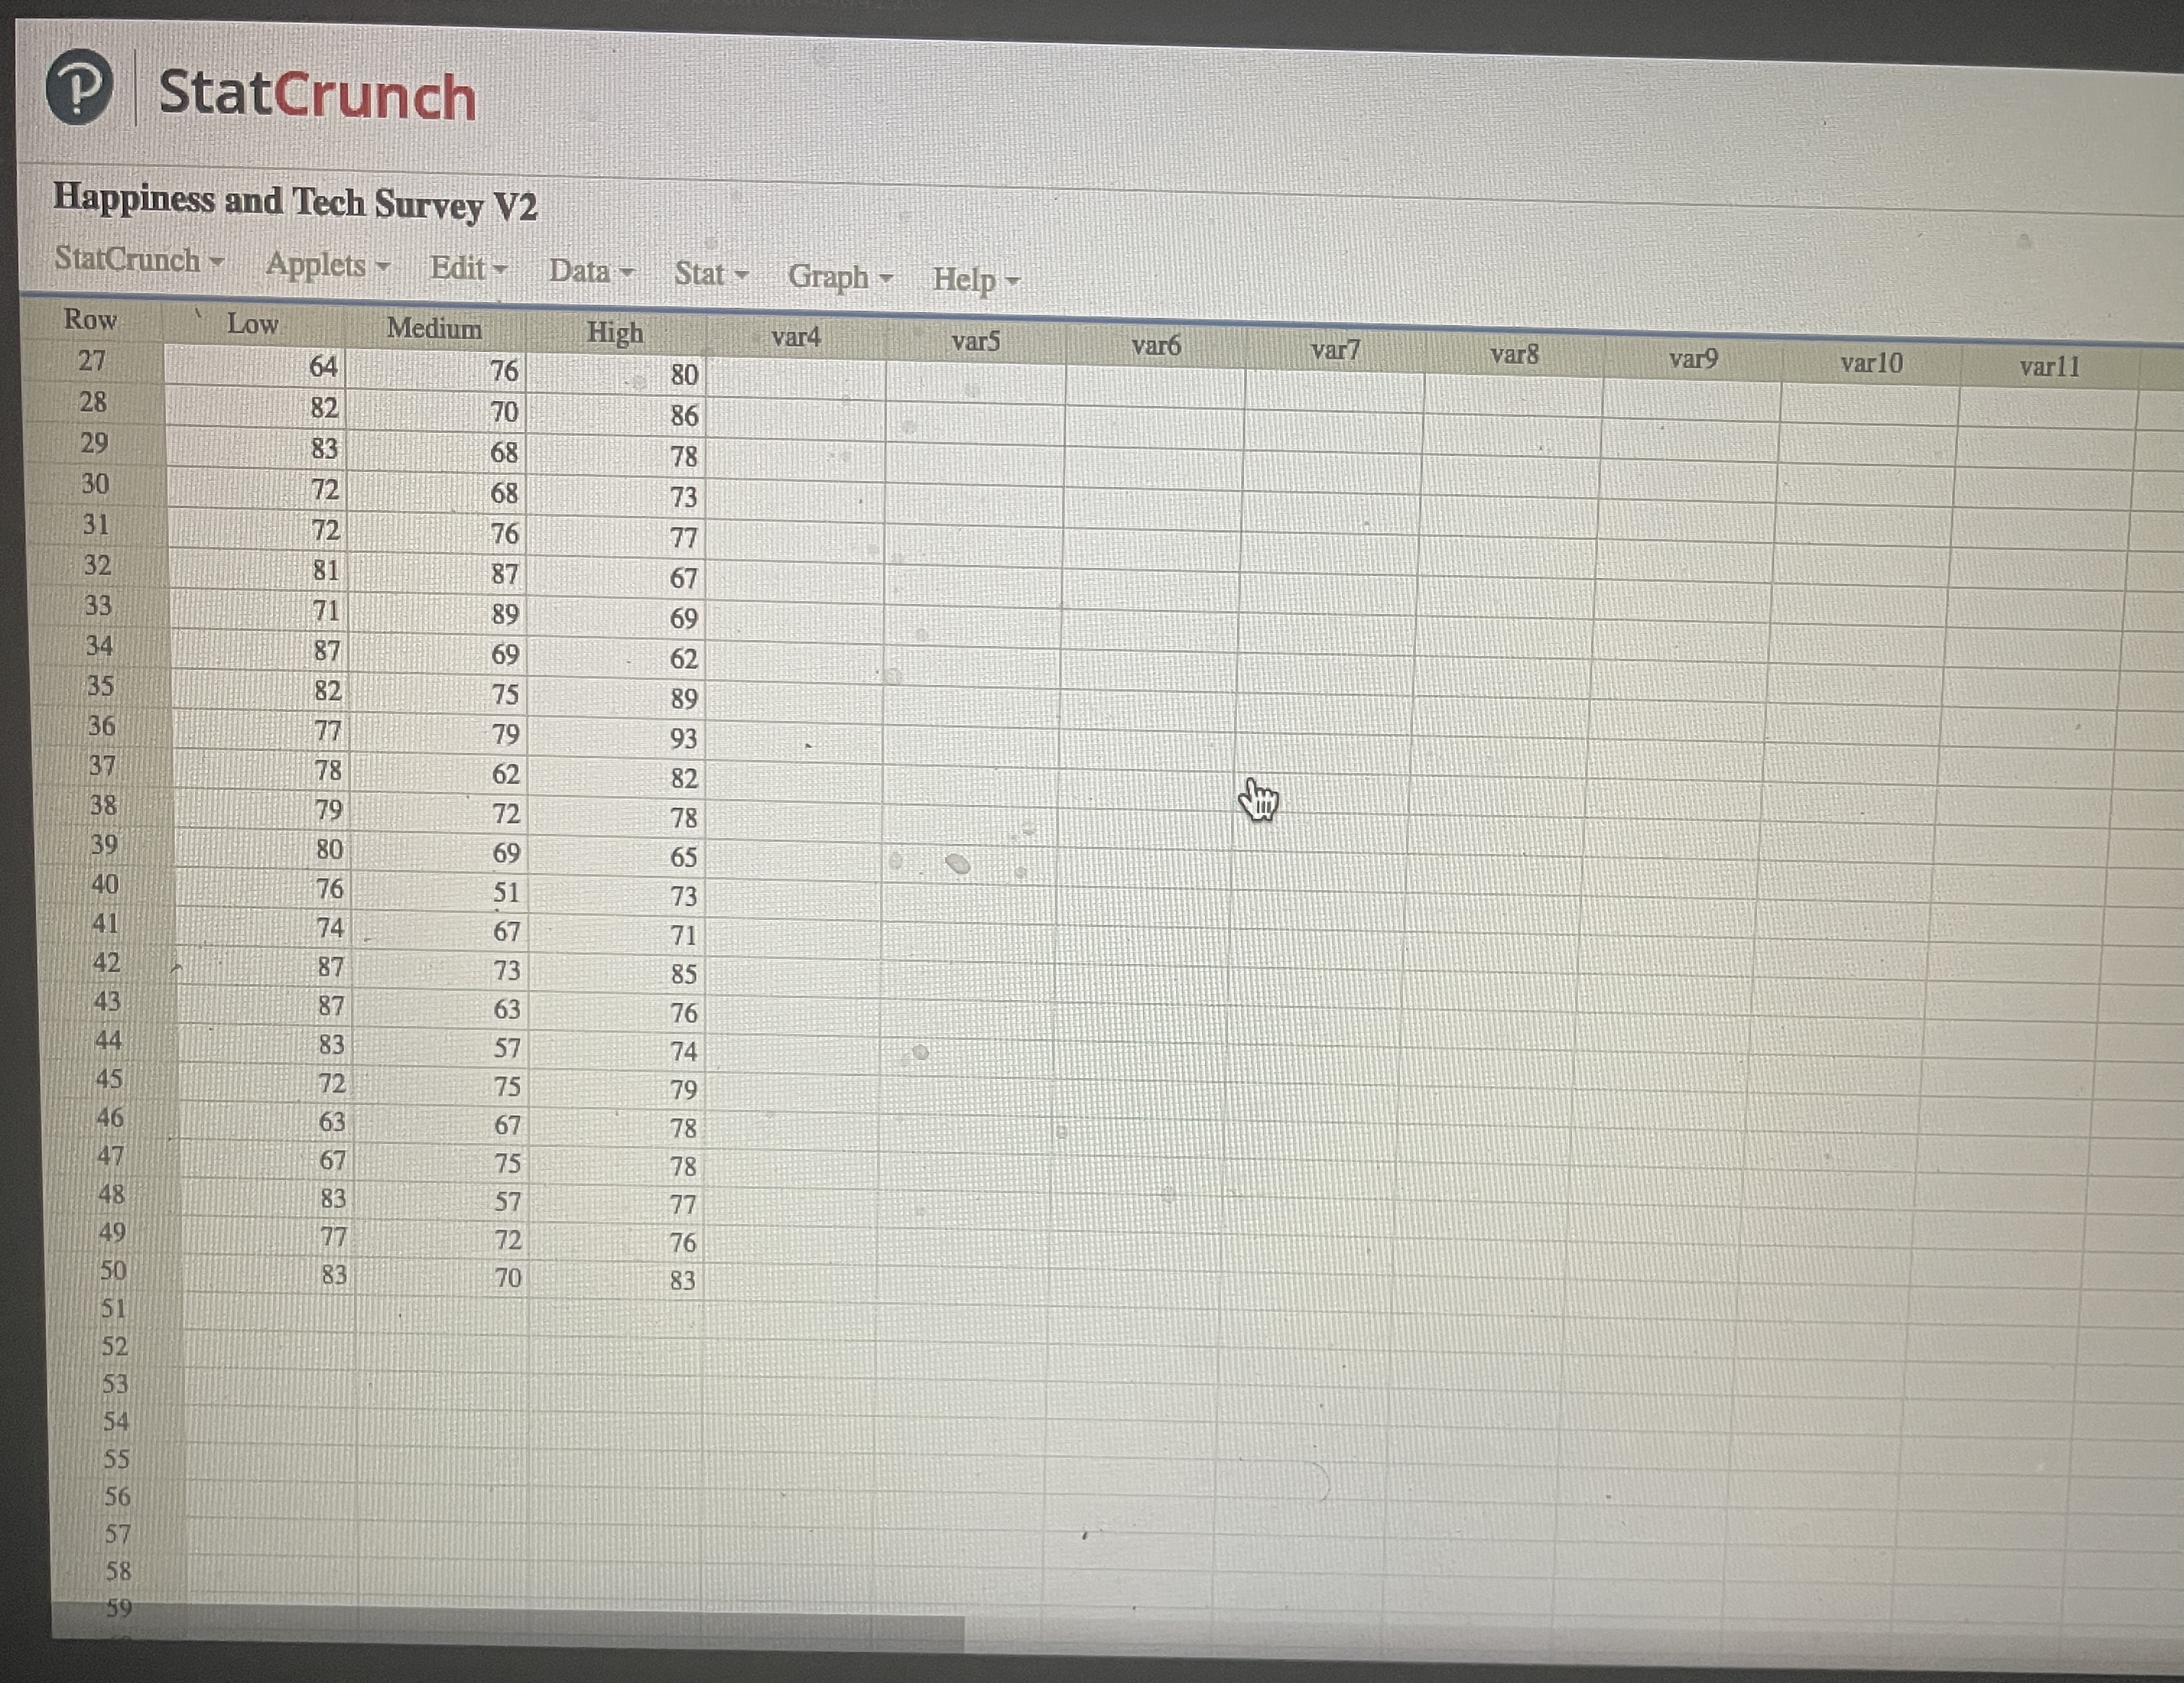
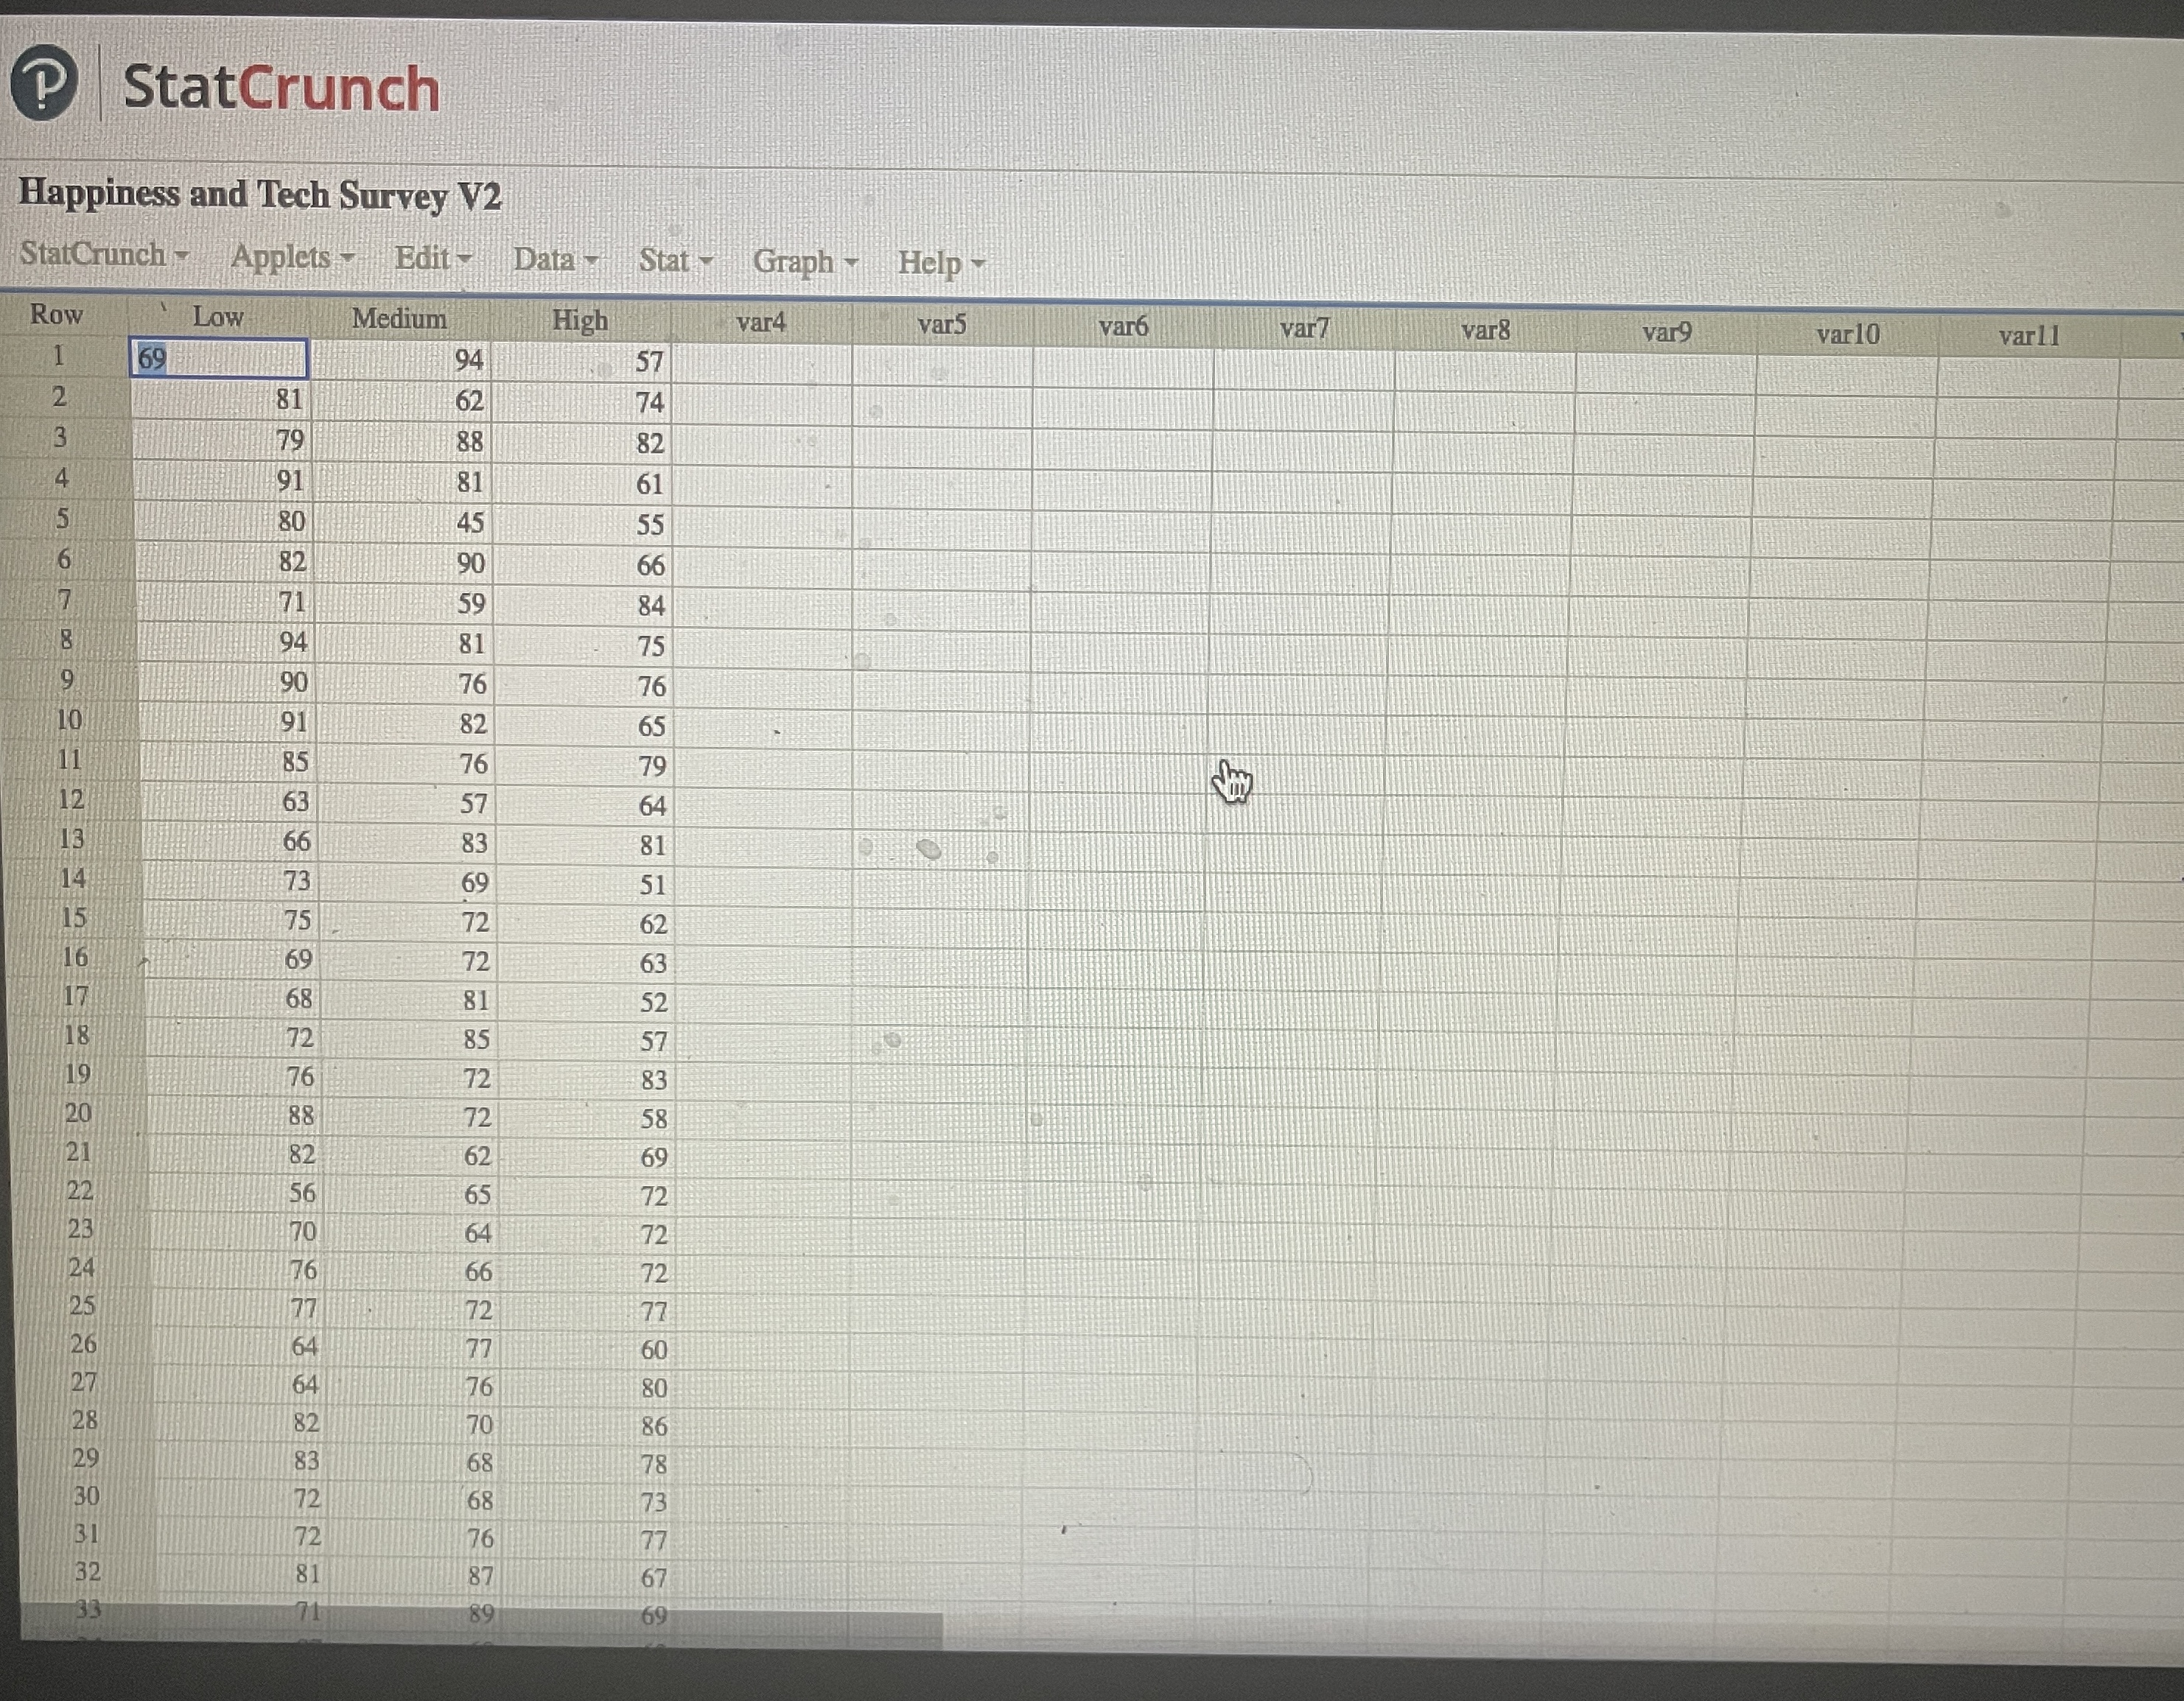
For question 7 and 8 I uploaded the data table!
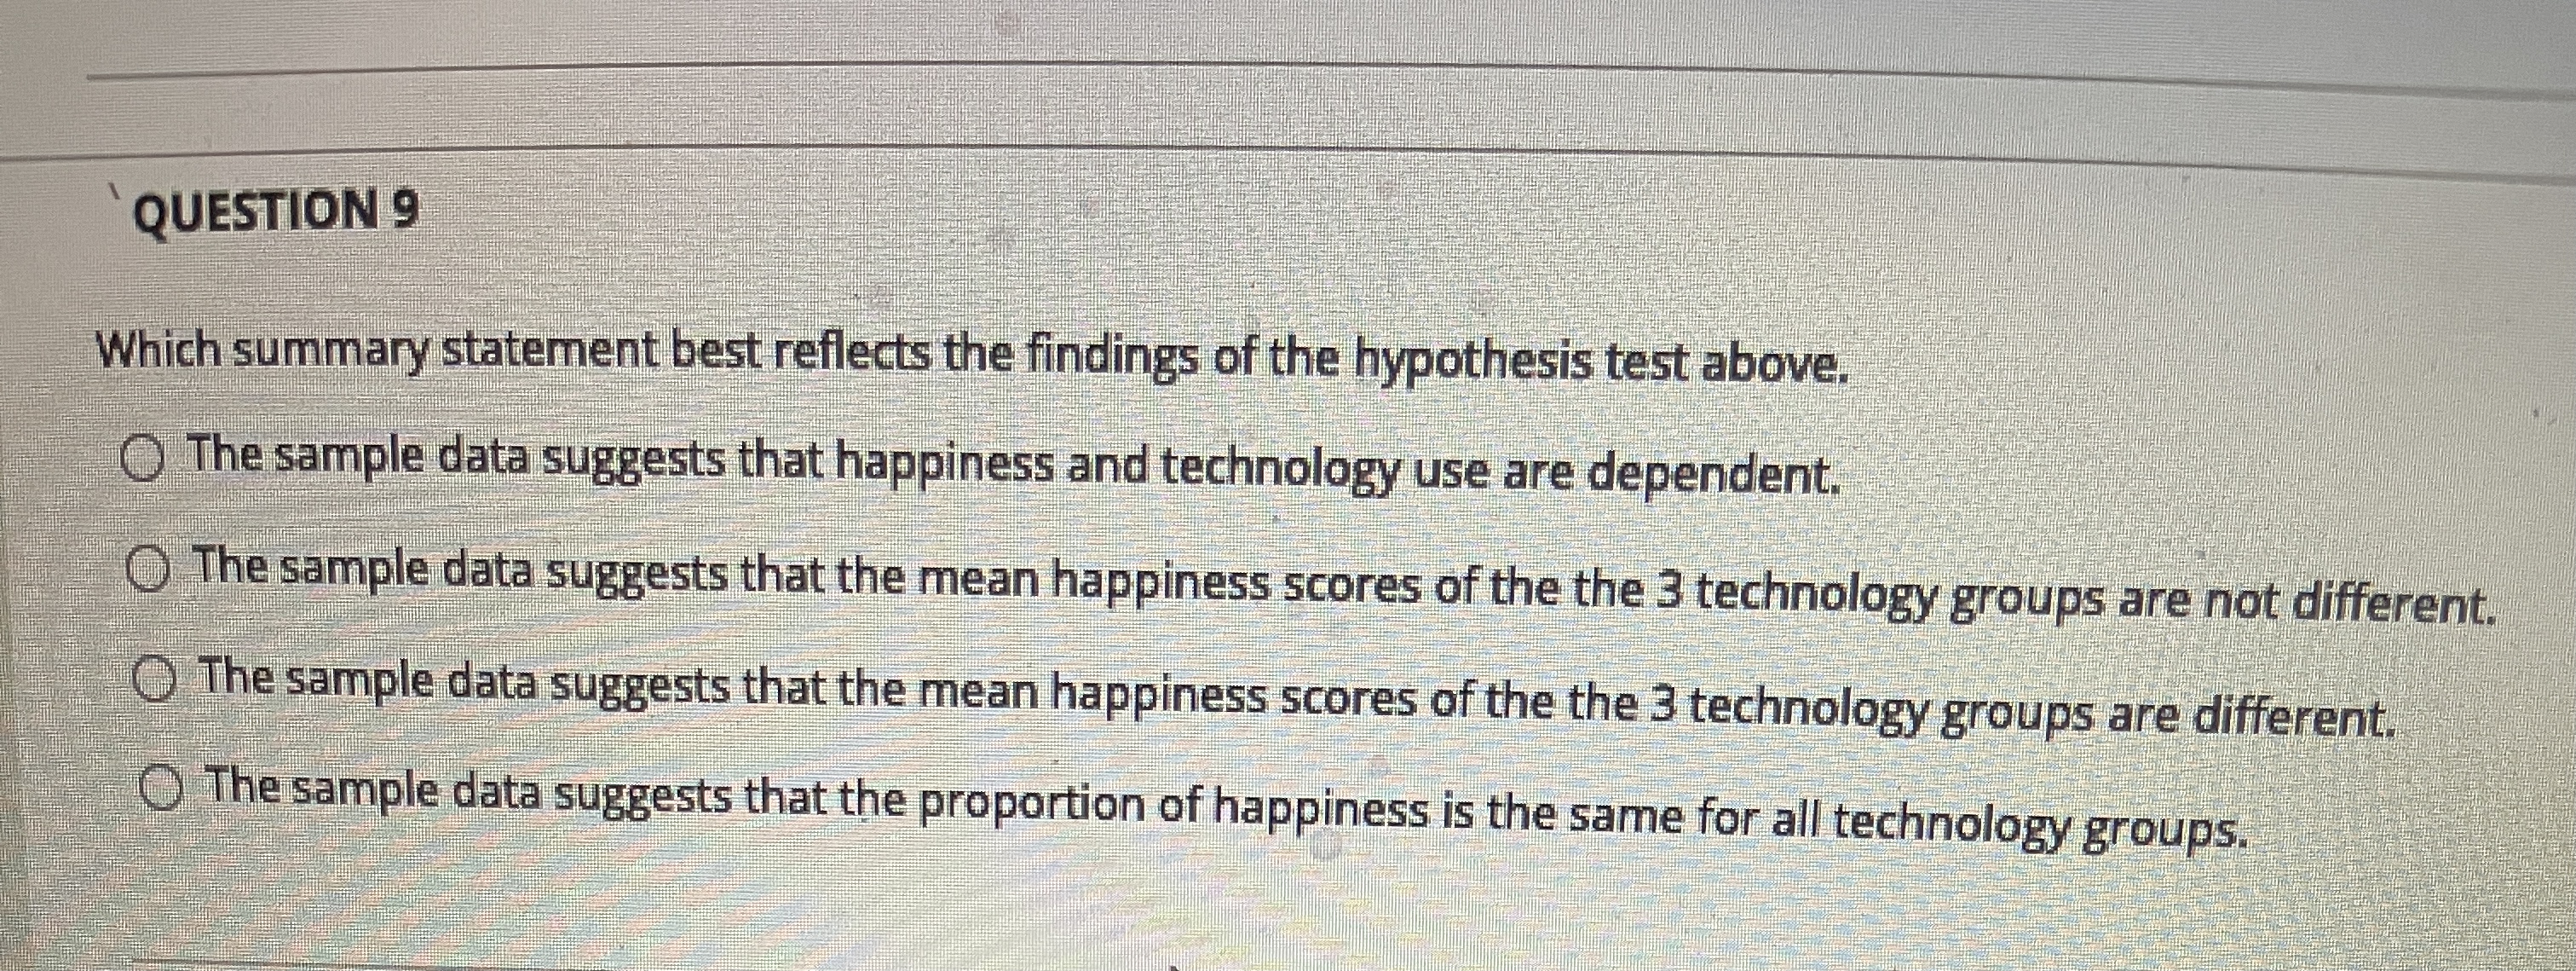
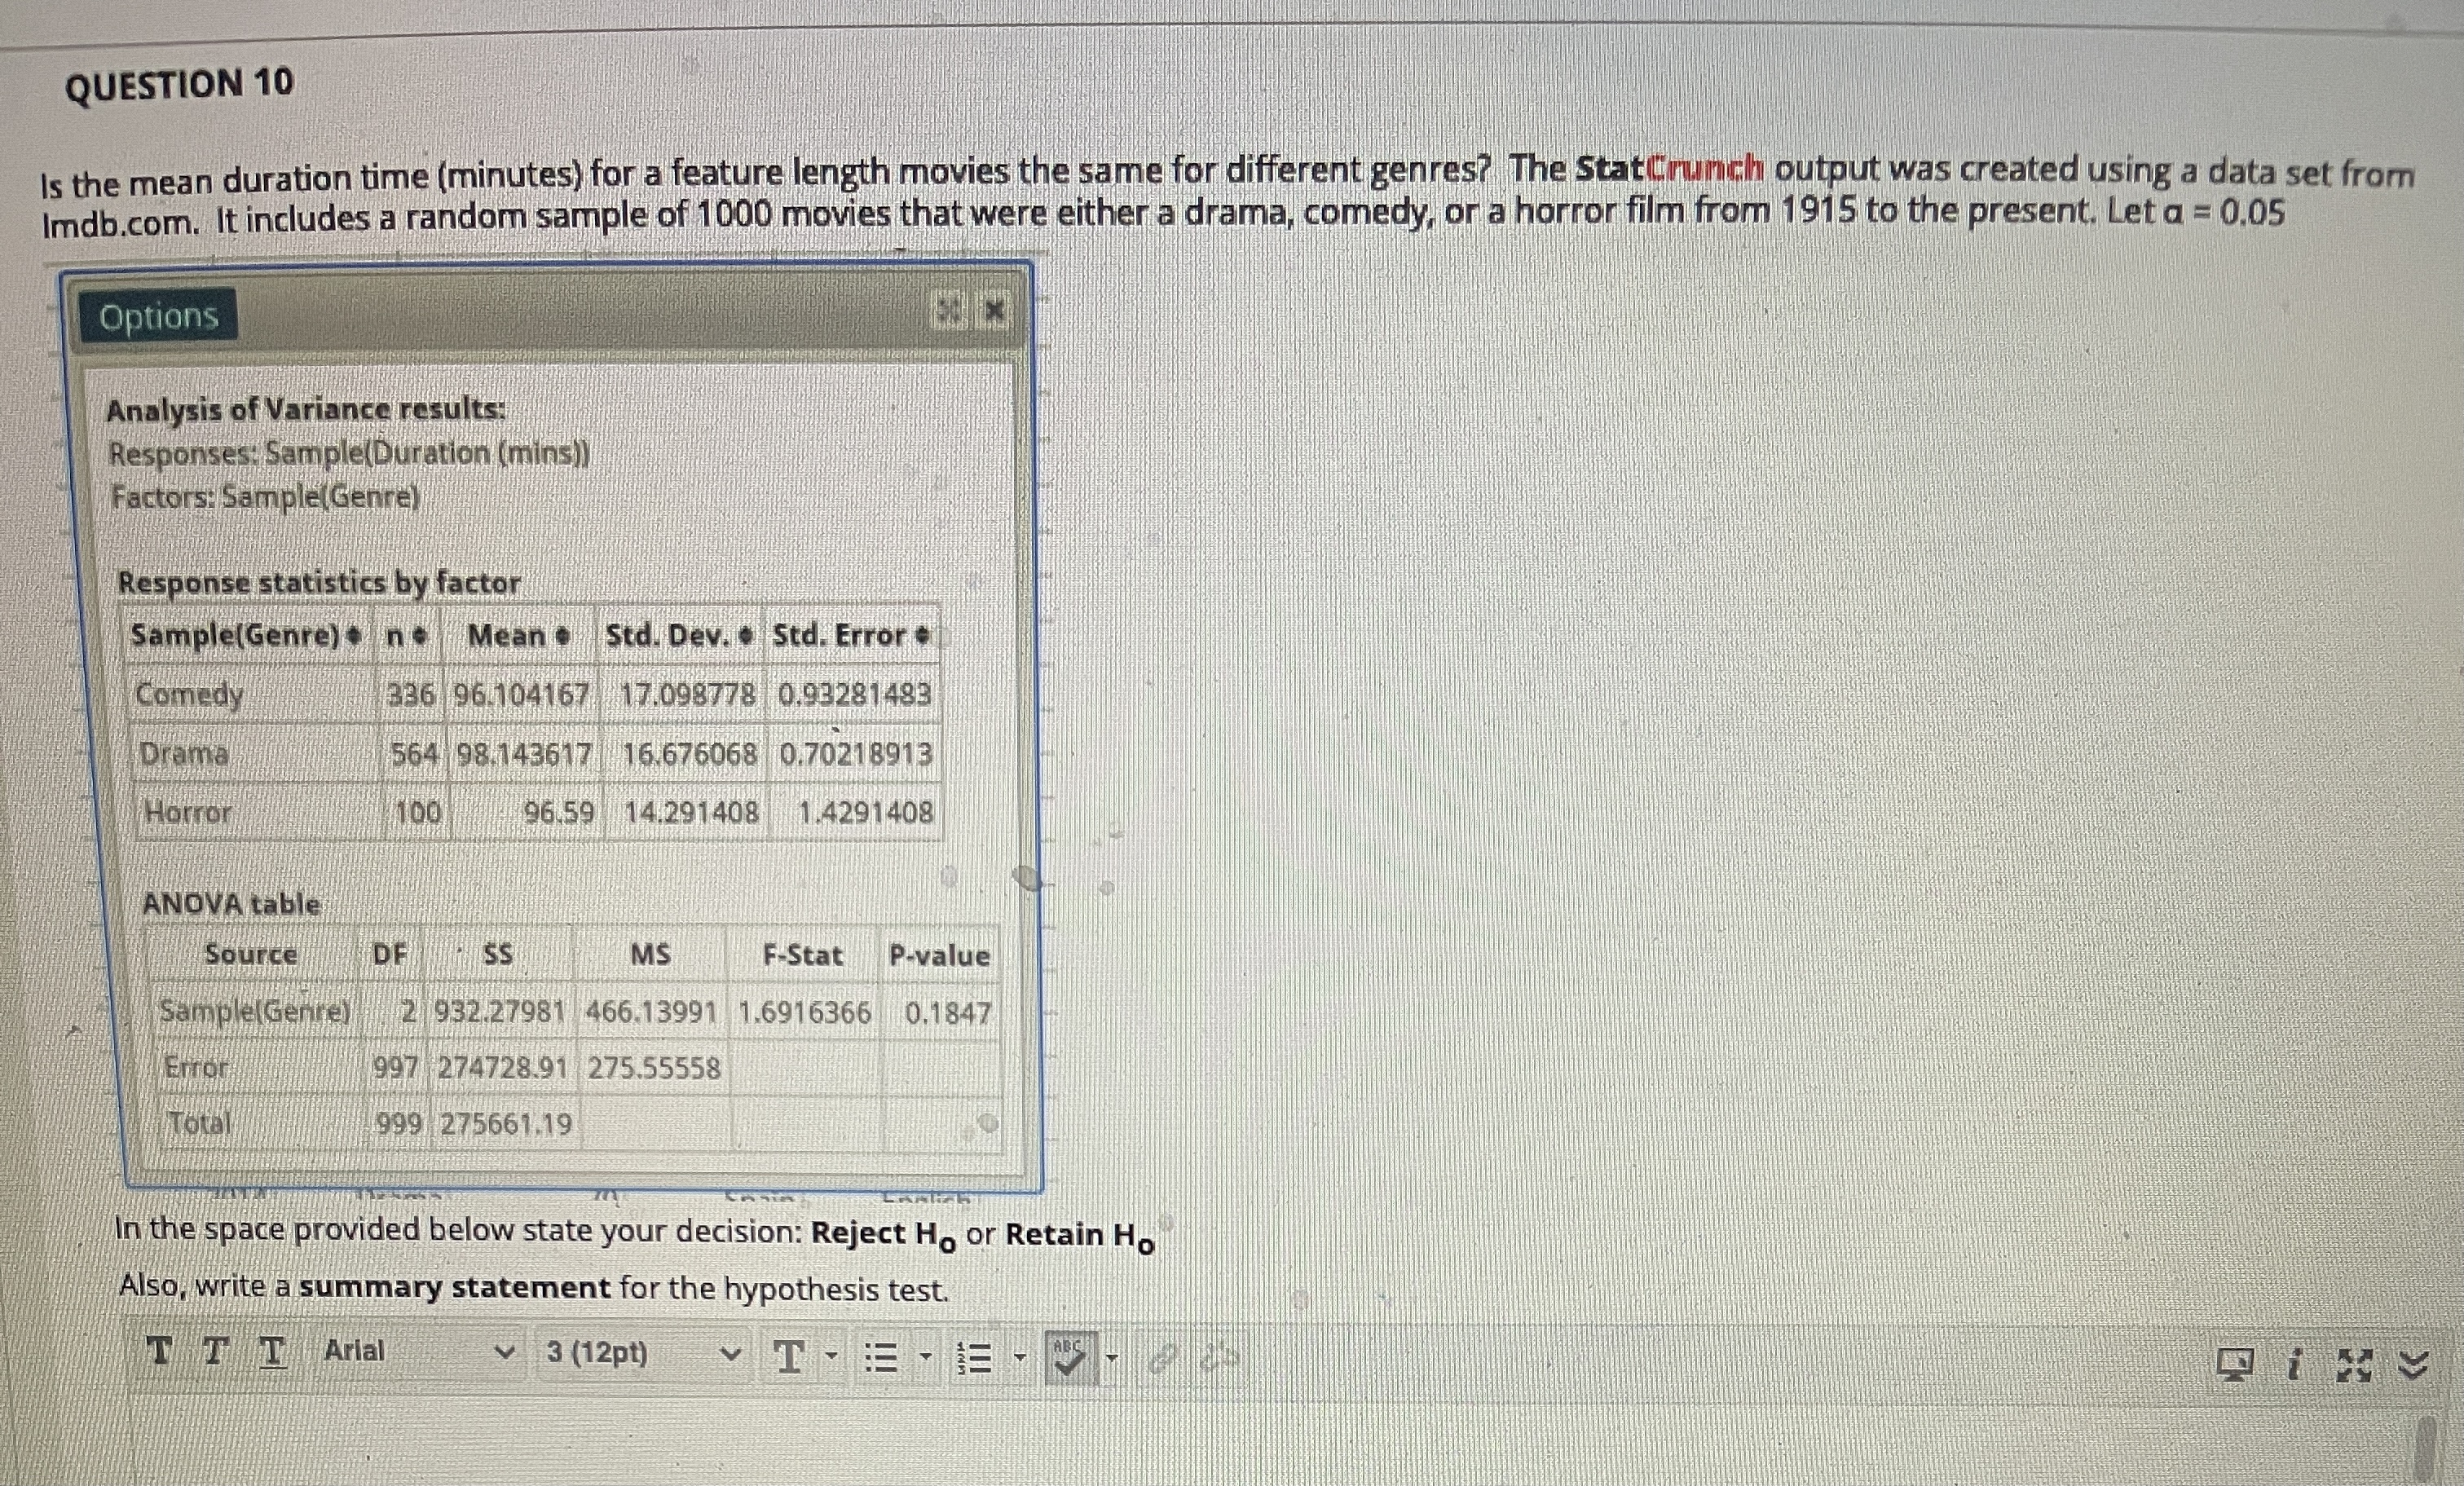
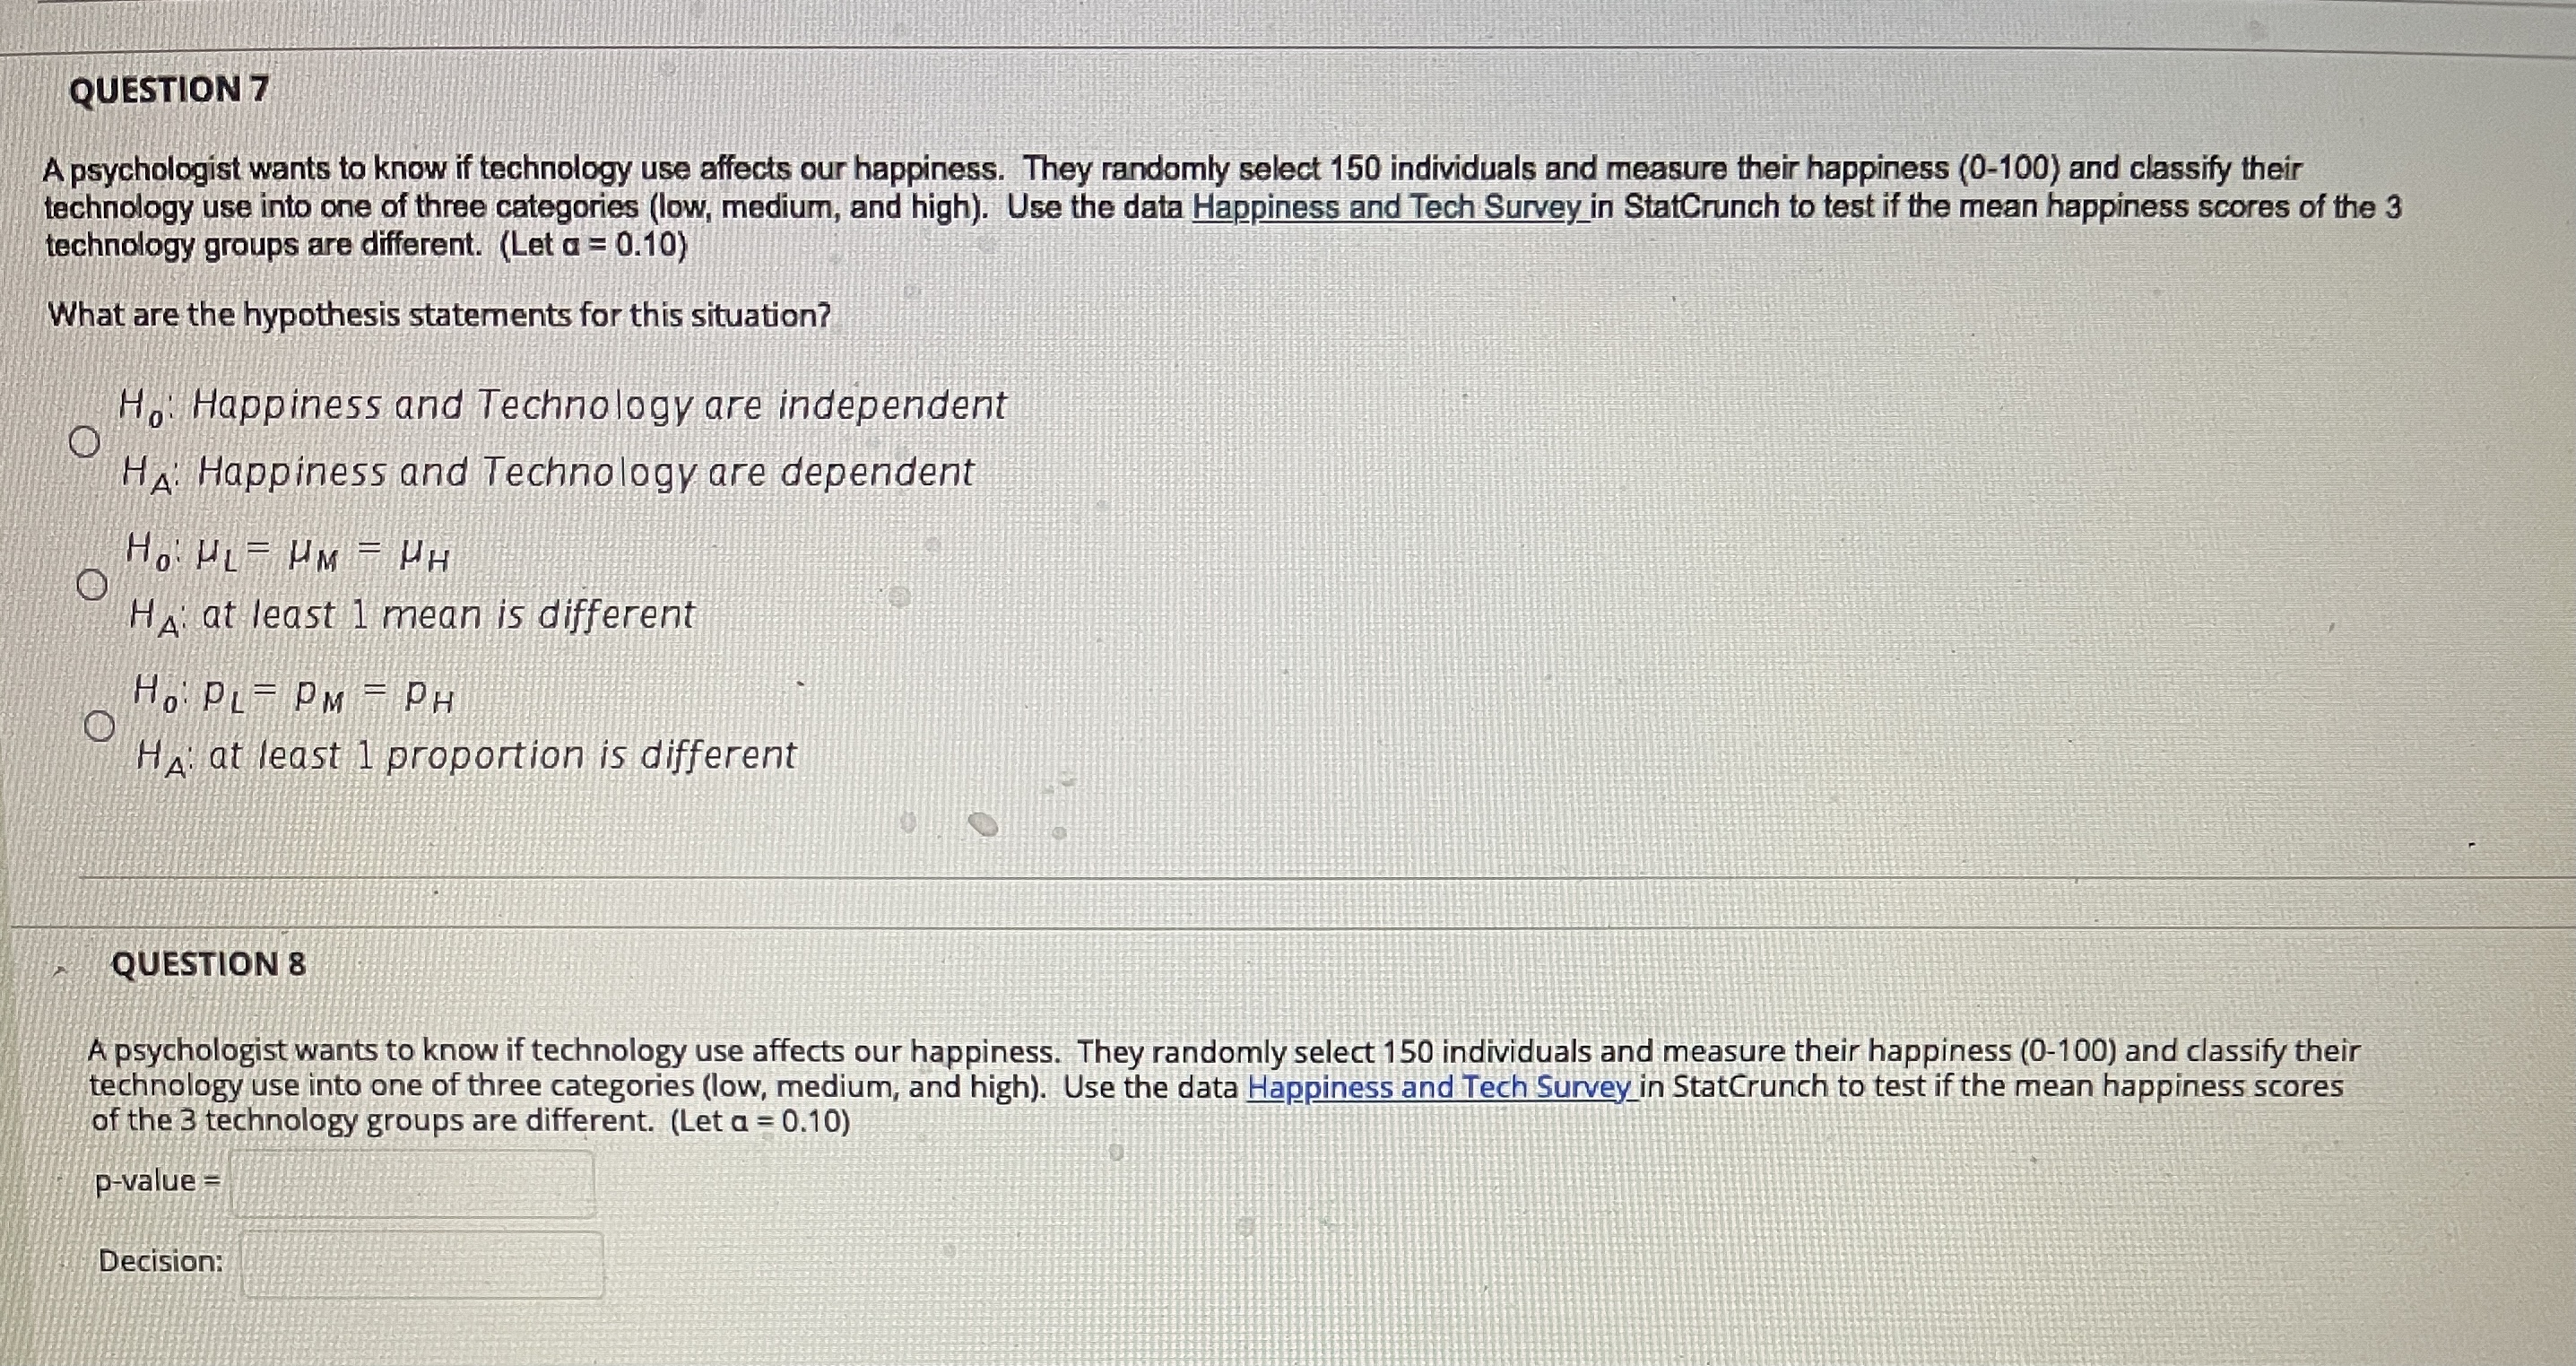
P StatCrunch Happiness and Tech Survey V2 StatCrunch - Applets- Edit- Data - Stat - Graph - Help Row Low Medium High var4 var5 var6 var? varg var9 var10 varll 27 64 76 80 28 82 70 86 29 83 68 78 30 72 68 73 31 72 76 77 32 81 87 67 33 71 89 69 62 73 85 74 79 78 78 77 76 70 83QUESTION 9 Which summary statement best reflects the findings of the hypothesis test above. O The sample data suggests that happiness and technology use are dependent. O The sample data suggests that the mean happiness scores of the the 3 technology groups are not different. The sample data suggests that the mean happiness scores of the the 3 technology groups are different. The sample data suggests that the proportion of happiness is the same for all technology groups.P StatCrunch Happiness and Tech Survey V2 StatCrunch - Applets - Edit - Data Stat Graph Help Row Low Medium High var4 vars var6 var7 Var8 vary var10 varll 1 69 94 57 81 62 74 79 88 82 91 81 61 80 45 55 90 66 59 84 75 76 65 79 64 81 51 62 63QUESTION 10 Is the mean duration time (minutes) for a feature length movies the same for different genres? The StatCrunch output was created using a data set from Imdb.com. It includes a random sample of 1000 movies that were either a drama, comedy, or a horror film from 1915 to the present. Let a = 0.05 Options Analysis of Variance results: Responses: Sample(Duration (mins)) Factors: Sample(Genre) Response statistics by factor Sample(Genre). no Mean . Std. Dev. . Std. Error Comedy 336 96.104167 17.098778 0.93281483 Drama 564 98.143617 16.676068 0.70218913 Horror 100 96.59 14.291408 1.4291408 ANOVA table Source DF SS MS F-Stat P-value Sample[Genre) 2 932.27981 466.13991 1.6916366 0.1847 Error 997 274728.91 275.55558 Tota 999 275661.19 In the space provided below state your decision: Reject H. or Retain Ho Also, write a summary statement for the hypothesis test. T T T Arial 3 (12pt) TEE- -QUESTION 7 A psychologist wants to know if technology use affects our happiness. They randomly select 150 individuals and measure their happiness (0-100) and classify their technology use into one of three categories (low, medium, and high). Use the data Happiness and Tech Survey in StatCrunch to test if the mean happiness scores of the 3 technology groups are different. (Let a = 0.10) What are the hypothesis statements for this situation? Ho: Happiness and Technology are independent O HA Happiness and Technology are dependent HOHL= HM T HH O HA: at least 1 mean is different Ho PL- PM - PH O HA: at least 1 proportion is different QUESTION 8 A psychologist wants to know if technology use affects our happiness. They randomly select 150 individuals and measure their happiness (0-100) and classify their technology use into one of three categories (low, medium, and high). Use the data Happiness and Tech Survey in StatCrunch to test if the mean happiness scores of the 3 technology groups are different. (Let a = 0.10) p-value = Decision
