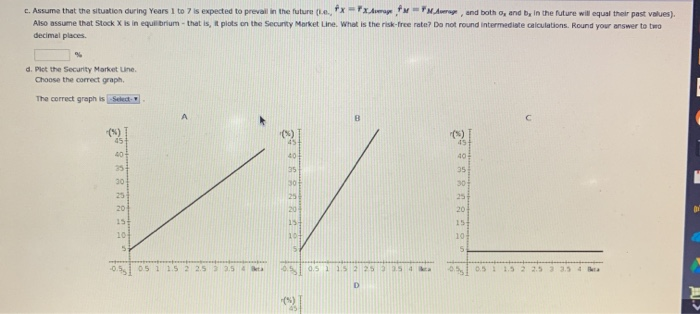
For question D if none of the graphs shown are correct it would be option "D" which is not shown. Hopefully this does not confuse anyone.
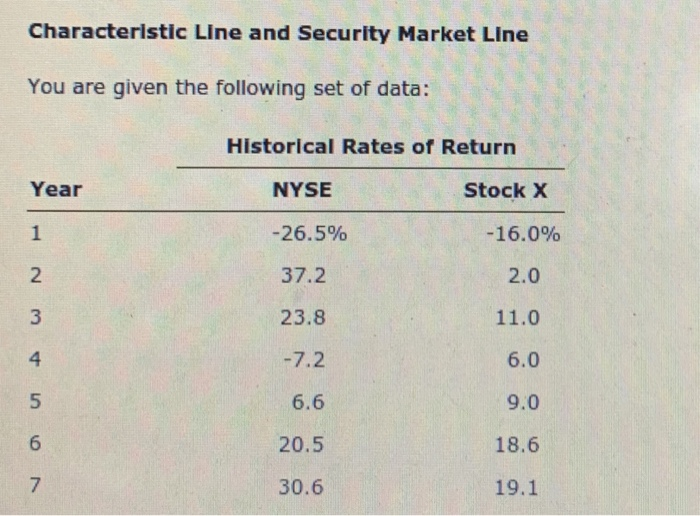
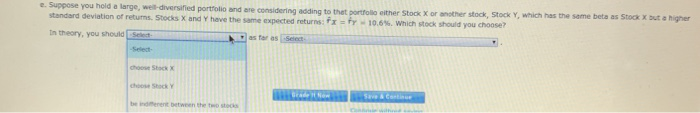
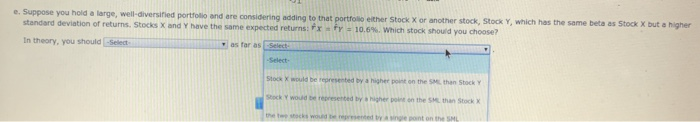
Characteristic Line and Security Market Line You are given the following set of data: Historical Rates of Return Year NYSE -26.5% Stock X -16.0% 37.2 2.0 23.8 11.0 -7.2 6.0 6.6 9.0 20.5 18.6 30.6 19.1 L. Assume that the situation during Years 1 to 7 is expected to prevall in the future X XA M M A and both , and be in the future will equal the past values Also assume that Stock X is in equorum that is, plots on the security Market Line. What is the risk-free rate? Do not round intermediate calculations. Round your answer to two decimal places d. Plot the Security Market Une Choose the correct graphs The correct graphis Select 0 05 1 1.5 2 2.5 3 3.5 05 5051 152 253 254 e. Suppose you hold a large, we diversified portfolio and are considering adding to that portfolio either Stock X or another stock, Stock Y, which has the same beta as Stock x but a higher standard deviation of returns Stocks X and Y have the same expected returns: Fr y - 10.6 Which stock should you choose? In theory, you should Select Brow s e a continue be n t between the two e. Suppose you hold a large, well-diversified portfolio and are considering adding to that portfolio either Stock X or another stock, Stock Y, which has the same beta as Stock x but a higher standard deviation of returns. Stocks X and Y have the same expected returns: Frf = 10.6% Which stock should you choose In theory, you should Select as far as Select -Select- Stock X would be represented by a higher point on the S than Stock Y och would be represented by higher out on the SM than Stock X stocks w e et ont on the SHL Characteristic Line and Security Market Line You are given the following set of data: Historical Rates of Return Year NYSE -26.5% Stock X -16.0% 37.2 2.0 23.8 11.0 -7.2 6.0 6.6 9.0 20.5 18.6 30.6 19.1 L. Assume that the situation during Years 1 to 7 is expected to prevall in the future X XA M M A and both , and be in the future will equal the past values Also assume that Stock X is in equorum that is, plots on the security Market Line. What is the risk-free rate? Do not round intermediate calculations. Round your answer to two decimal places d. Plot the Security Market Une Choose the correct graphs The correct graphis Select 0 05 1 1.5 2 2.5 3 3.5 05 5051 152 253 254 e. Suppose you hold a large, we diversified portfolio and are considering adding to that portfolio either Stock X or another stock, Stock Y, which has the same beta as Stock x but a higher standard deviation of returns Stocks X and Y have the same expected returns: Fr y - 10.6 Which stock should you choose? In theory, you should Select Brow s e a continue be n t between the two e. Suppose you hold a large, well-diversified portfolio and are considering adding to that portfolio either Stock X or another stock, Stock Y, which has the same beta as Stock x but a higher standard deviation of returns. Stocks X and Y have the same expected returns: Frf = 10.6% Which stock should you choose In theory, you should Select as far as Select -Select- Stock X would be represented by a higher point on the S than Stock Y och would be represented by higher out on the SM than Stock X stocks w e et ont on the SHL