Question
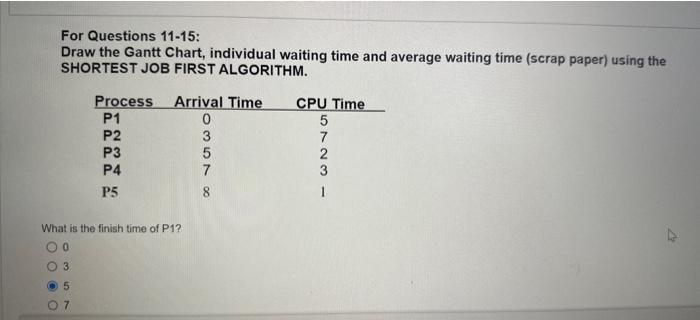
For Questions 11-15: Draw the Gantt Chart, individual waiting time and average waiting time (scrap paper) using the SHORTEST JOB FIRST ALGORITHM. Process P1


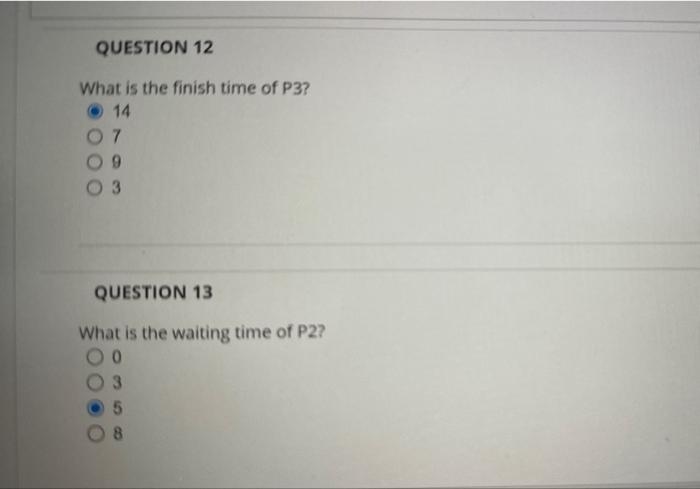
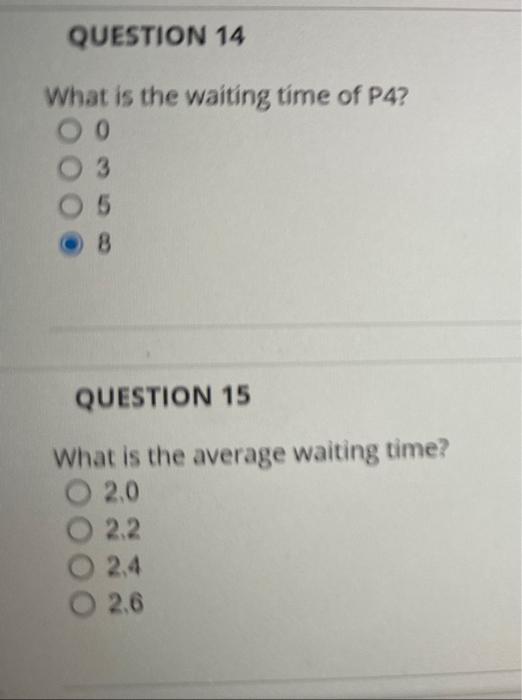
For Questions 11-15: Draw the Gantt Chart, individual waiting time and average waiting time (scrap paper) using the SHORTEST JOB FIRST ALGORITHM. Process P1 Arrival Time 0 CPU Time 5 P2 3 7 P3 5 2 P4 P5 7 3 8 What is the finish time of P1? 0 O3 35 07 QUESTION 12 What is the finish time of P3? 14 9 3 QUESTION 13 What is the waiting time of P2? QUESTION 14 What is the waiting time of P4? 00 8 QUESTION 15 What is the average waiting time? 2.0 2.2 2.4 2.6
Step by Step Solution
There are 3 Steps involved in it
Step: 1
The detailed answer for the above question is provided below Question 11 5 Calculate the average wai...
Get Instant Access to Expert-Tailored Solutions
See step-by-step solutions with expert insights and AI powered tools for academic success
Step: 2

Step: 3

Ace Your Homework with AI
Get the answers you need in no time with our AI-driven, step-by-step assistance
Get StartedRecommended Textbook for
Operating Systems Internals and Design Principles
Authors: William Stallings
8th edition
133805913, 978-0133805918
Students also viewed these Programming questions
Question
Answered: 1 week ago
Question
Answered: 1 week ago
Question
Answered: 1 week ago
Question
Answered: 1 week ago
Question
Answered: 1 week ago
Question
Answered: 1 week ago
Question
Answered: 1 week ago
Question
Answered: 1 week ago
Question
Answered: 1 week ago
Question
Answered: 1 week ago
Question
Answered: 1 week ago
Question
Answered: 1 week ago
Question
Answered: 1 week ago
Question
Answered: 1 week ago
Question
Answered: 1 week ago
Question
Answered: 1 week ago
Question
Answered: 1 week ago
Question
Answered: 1 week ago
Question
Answered: 1 week ago
Question
Answered: 1 week ago
Question
Answered: 1 week ago
View Answer in SolutionInn App


