Question: For R, partition the data sets into 60% training and 40% validation and implement the 10-fold cross-validation. Use the statement set. seed(1) to specify the
For R, partition the data sets into 60% training and 40% validation and implement the 10-fold cross-validation. Use the statement set. seed(1) to specify the random seed for data partitioning and cross-validation. When searching for the optimal value of k, search within possible k values from 1 to 10. If the predictor variable values are in the character format, then treat the predictor variable as a categorical variable. Otherwise, treat the predictor variable as a numerical variable.
Online retailers often use a recommendation system to suggest new products to consumers. Consumers are compared to others with similar characteristics such as past purchases, age, income, and education level. A data set, such as the one shown in the accompanying table, is often used as part of a product recommendation system in the retail industry. The variables used in the system include whether or not the consumer eventually purchases the suggested item (Purchase = 1 if purchased, 0 otherwise), the consumer’s age (Age in years), income (Income, in $1,000s), and a number of similar items previously purchased (PastPurchase).
| Purchase | Age | Income | PastPurchase |
| 1 | 48 | 99 | 21 |
| 1 | 47 | 32 | 0 |
| ⋮ | ⋮ | ⋮ | ⋮ |
| 0 | 34 | 110 | 2 |
a-1. Perform KNN analysis on the Retail_Data worksheet to determine the optimal k. Use 0.5 as the cutoff value for this analysis. Enter the optimal k in the box below:
a-2. Score the records of 8 new consumers in the Retail_Score worksheet, using 0.5 as the cutoff value. Enter the predicted values for the first new consumers below:
b. What is the misclassification rate for the optimal k for the training data set? Enter the misclassification rate in the box below: (Report the misclassification rate in percentage. Round your answer to 2 decimal places.)
c-1. Report the accuracy, specificity, sensitivity, and precision rates (in proportions) for the validation data set. (Round your answers to 2 decimal places.)
c-2. Which of the following statements is least accurate?
multiple choice
A. The error rate of the KNN model is 30%.
B. The KNN model is able to correctly classify 74% of the customers who purchased.
C. The KNN model is able to correctly classify 67% of the customers who did not purchase.
D. Overall, the KNN model is able to correctly classify 72% of the customers.
d. Obtain the decile-wise chart. What is the lift of the leftmost bar of the decile-wise chart? (Round your answer to 2 decimal places.)
e. Obtain the ROC curve. What is the AUC value of the ROC curve? (Round your answer to 4 decimal places.)
f. Which of the following statements is the least accurate?
multiple choice
A. Using 0.5 as the cutoff value, the KNN classifier has higher accuracy than the naïve rule (classifying all cases into the predominant class).
B. The cumulative lift chart shows that the KNN classifier performs better than the baseline model (random classifier).
C. The ROC curve shows that the KNN classifier performs better than the baseline model in terms of sensitivity but not in terms of specificity.
D. The leftmost bar of the decile-wise chart suggests a lift of more than 1 for the top 10% of the test cases with the highest predicted target class probabilities.


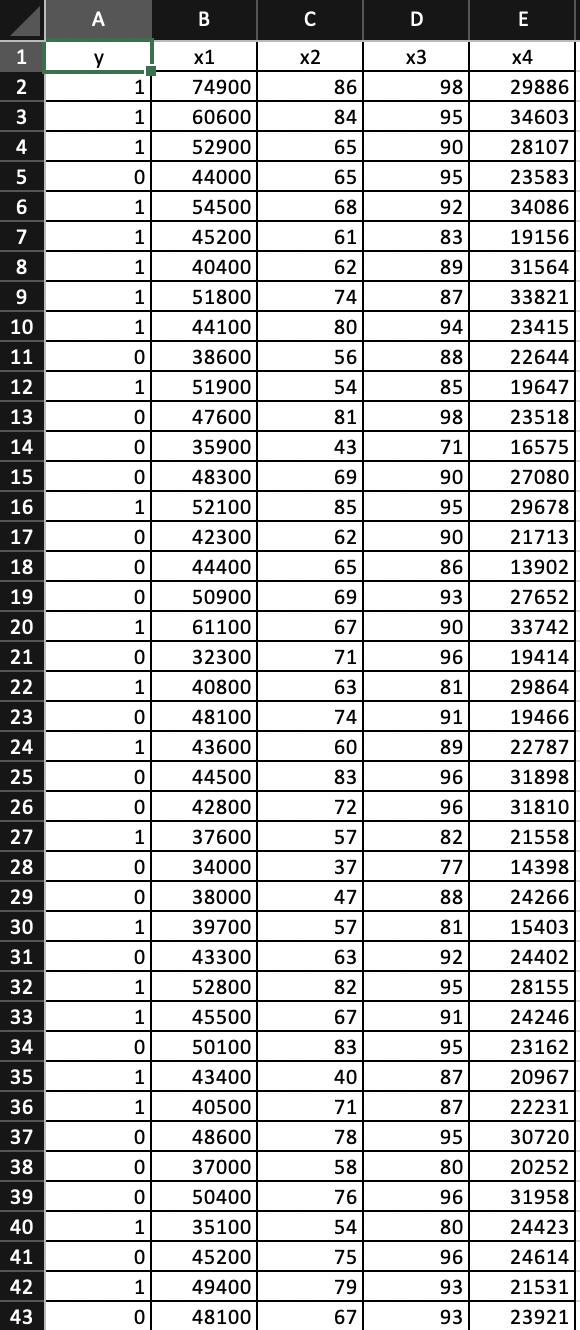
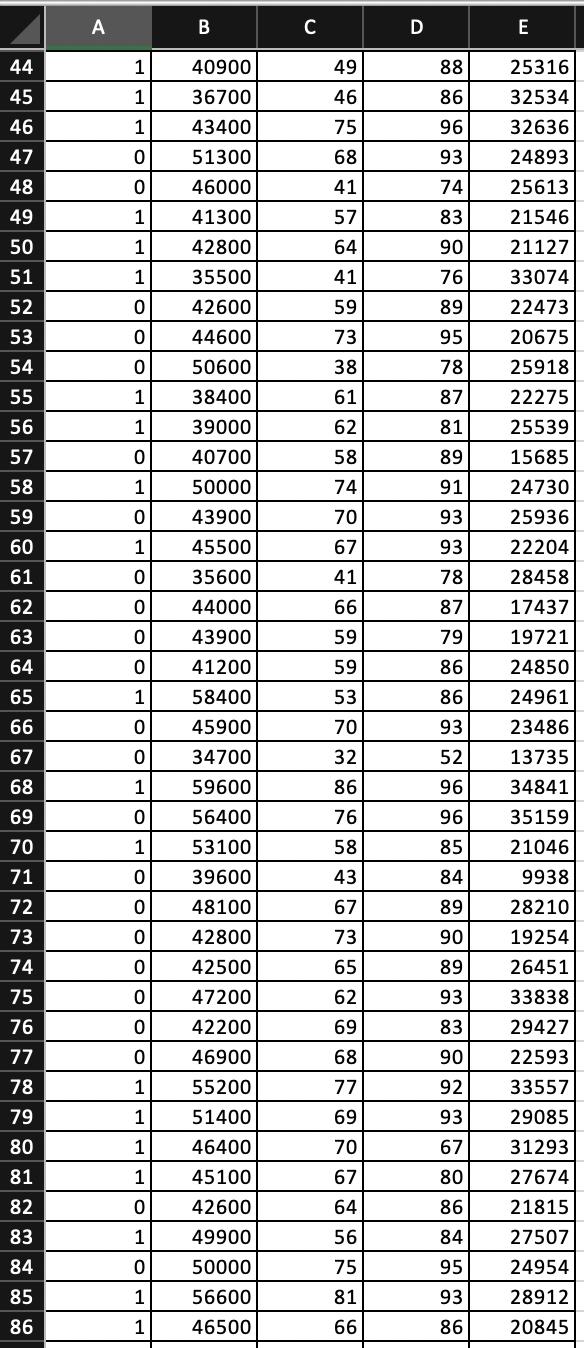
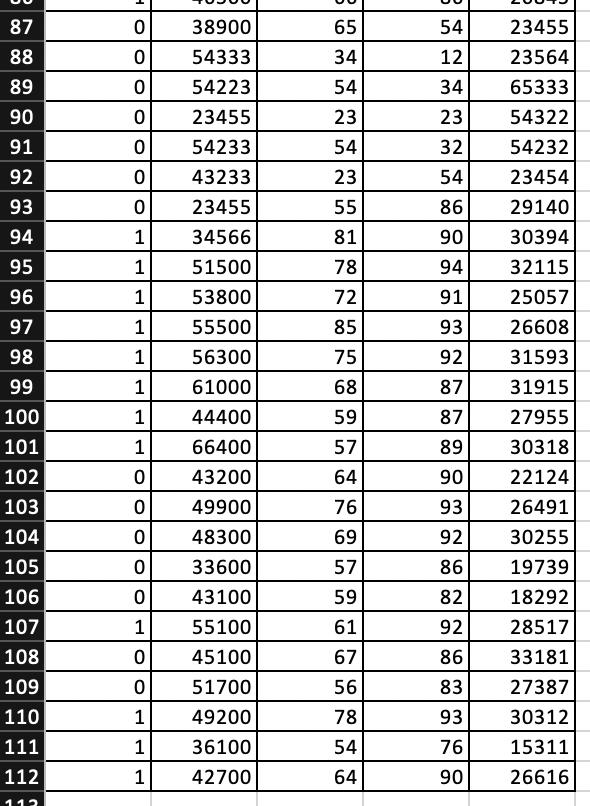
1 2 3 4 5 6 7 8 9 10 11 12 13 14 15 16 17 18 19 20 21 22 23 24 25 26 27 28 29 30 31 32 33 34 35 36 37 38 39 40 41 42 43 A Y 1 1 1 0 1 1 1 1 1 0 1 0 0 0 1 0 0 0 1 0 1 0 1 0 0 1 0 0 1 0 1 1 0 1 1 0 0 0 1 0 1 0 B x1 74900 60600 52900 44000 54500 45200 40400 51800 44100 38600 51900 47600 35900 48300 52100 42300 44400 50900 61100 32300 40800 48100 43600 44500 42800 37600 34000 38000 39700 43300 52800 45500 50100 43400 40500 48600 37000 50400 35100 45200 49400 48100 UN C x2 86 84 65 65 68 61 62 74 80 56 54 81 43 69 85 62 65 69 67 71 63 74 60 83 72 57 37 47 57 63 82 67 83 40 71 78 58 76 54 75 79 67 D x3 98 95 90 95 92 83 89 87 94 88 85 98 71 90 95 90 86 93 90 96 81 91 89 96 96 82 77 88 81 92 95 91 95 87 87 95 80 96 80 96 93 93 E x4 29886 34603 28107 23583 34086 19156 31564 33821 23415 22644 19647 23518 16575 27080 29678 21713 13902 27652 33742 19414 29864 19466 22787 31898 31810 21558 14398 24266 15403 24402 28155 24246 23162 20967 22231 30720 20252 31958 24423 24614 21531 23921
Step by Step Solution
There are 3 Steps involved in it
KNN Model Evaluation on RetailData a1 Optimal k Value Optimal k 7 a2 Predicted Values for First 8 Ne... View full answer

Get step-by-step solutions from verified subject matter experts


