Answered step by step
Verified Expert Solution
Question
1 Approved Answer
for some reason none of my calculations are coming out correctly. please caculate: raw materials for 2006, 2007, 2007, 2008, 2009, and 2010 it gives
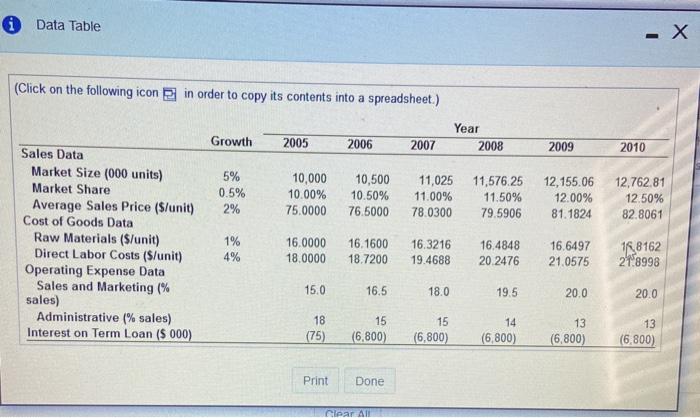
for some reason none of my calculations are coming out correctly.
please caculate: raw materials for 2006, 2007, 2007, 2008, 2009, and 2010
it gives the formula of market size x market share x raw materials per unit
thank you!
Step by Step Solution
There are 3 Steps involved in it
Step: 1

Get Instant Access to Expert-Tailored Solutions
See step-by-step solutions with expert insights and AI powered tools for academic success
Step: 2

Step: 3
Ace Your Homework with AI
Get the answers you need in no time with our AI-driven, step-by-step assistance
Get Started