

Question
For the cross-tabulation data shown below, which represents a count of the type of books that individuals prefer, verify that the assumptions of the chi-square
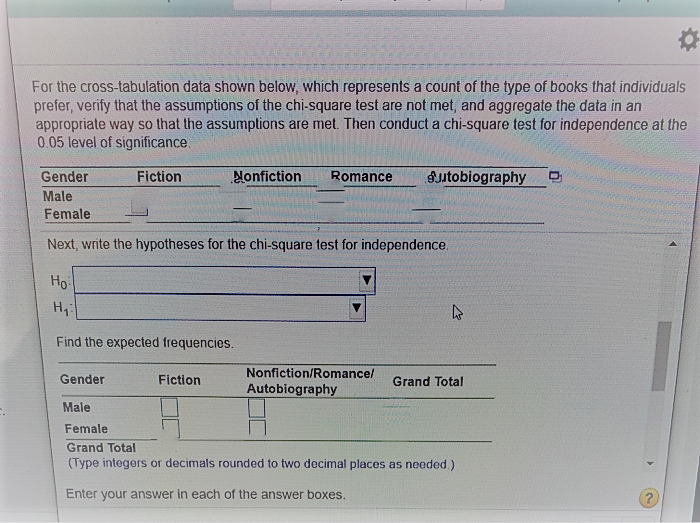
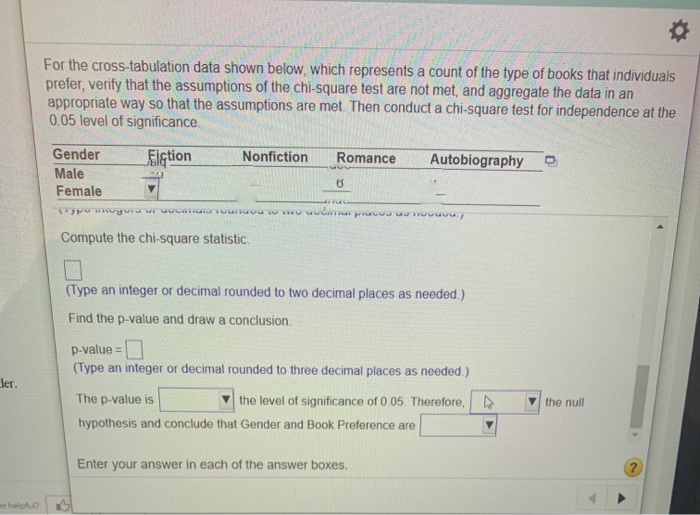
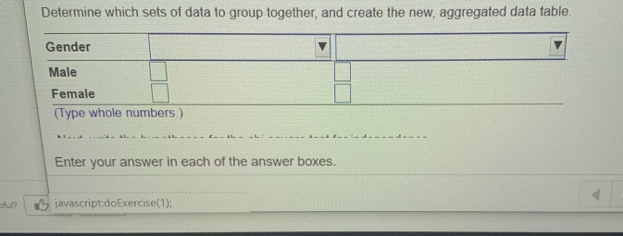
For the cross-tabulation data shown below, which represents a count of the type of books that individuals prefer, verify that the assumptions of the chi-square test are not met, and aggregate the data in an appropriate way so that the assumptions are met. Then conduct a chi-square test for independence at the 0.05 level of significance.
| Gender | Fiction | Nonfiction | Romance | Autobiography |
| Male | 10 | 2 | 2 | 6 |
| Female | 7 | 5 | 2 | 0 |
Step by Step Solution
There are 3 Steps involved in it
Step: 1

Get Instant Access to Expert-Tailored Solutions
See step-by-step solutions with expert insights and AI powered tools for academic success
Step: 2

Step: 3
Ace Your Homework with AI
Get the answers you need in no time with our AI-driven, step-by-step assistance
Get Started
Trigonometry A Unit Circle Approach (Subscription)
Authors: Michael Sullivan
10th Edition
0134178785, 9780134178783