For the data in Question 3, calculate the 6sigma, the Cp andthe Cpk. Interpret the indices. The specification limits are 50+/- 0.5.
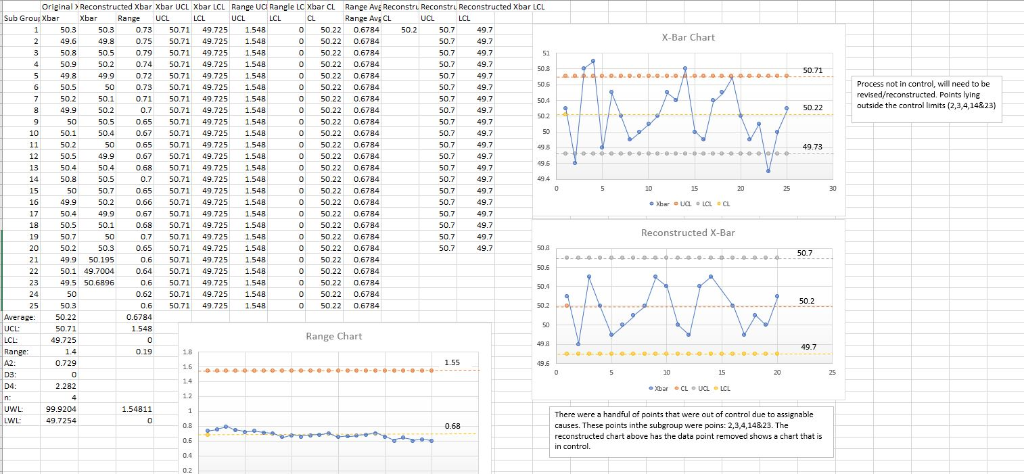
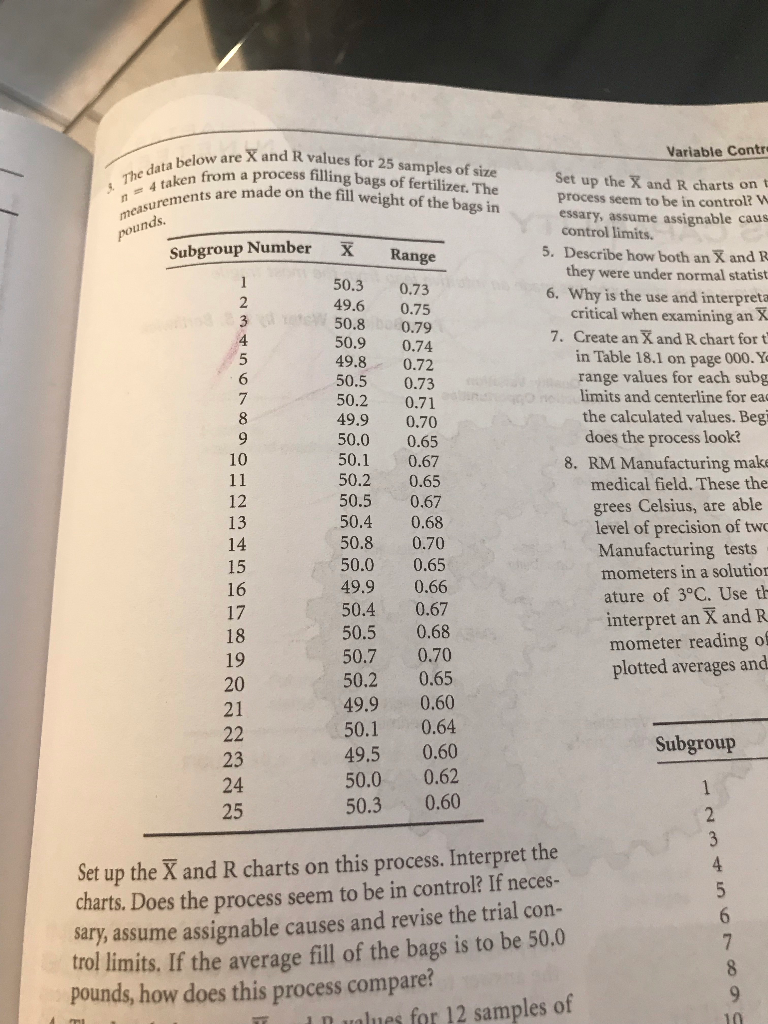
Original >Reconstructed Xbar Xbar UCL xbar LCL Range UC Rangle LC xbar CL Range AvE Reconstri Reconstru xbar LCL Sub Group Xbar Xbar Range UCL LCL Range Avs CL 0.7350.7 49.725 1.548 0.75 50.71 497251.548 0.79 507 49.725 1.548 0.74 50.71 497251.548 5 49.849.9 0.72 50.71 49.725 1.548 50 0.73 50.71 49.725 1.548 071 50.71 49.725 1.548 0.7 50.71 49.7251.548 0.65 507 49.725 1.548 10 50.1 50.407 50.71 49.725 1.548 0.65 507 49.725 1.548 50.5 49.975071 49.7251.548 0.68 507 49725 1548 0.7 50.71 49.7251.548 0.65 507 49.725 1.548 0.66 50.71 725 1.548 0.67 507 49.725 1.548 18 50.5 50.1 0.8 50.71 725 1.548 0.7 50.71 49.725 1.548 0.65 50.71 9725 1.548 06 50.71 49.725 1.548 50.1 49.7004 0.0.71 49725 1.548 06 50.71 49.725 1,548 0.62 50.71 9725 1.548 06 50,71 49.725 1548 50.3 49.649.8 50.8 50.9 50.3 0 50.22 0.6784 50.2 50.7 X-Bar Chart 2 0 50.22 0.6784 50.22 0.6784 0 50.22 0.6784 0 50.22 0.6784 0 50.22 0.6784 0 50.22 0.6784 0 50.22 0.6784 0 50.22 0.6784 0 50.22 0.6784 0 50.22 0.6784 0 50.22 0.6784 50.22 0.6784 0 50.22 0.6784 0 50.22 0.6784 0 50.22 0.6784 50.22 0.6784 0 50.22 0.6784 50 22 0.6784 0 50.22 0.6784 50 22 0,6784 0 50.22 0.6784 50 22 0.6784 0 50.22 0.6784 50 22 0,6784 50.5 50.2 51 0.74 50 71 Process not in control, will need to be revised/reconstructed. Points lying outside the control limits (2,3,4,14&23) 50.5 50.1 49.9 50 50.5 50 49.73 14 50.8 50.5 50 50.7 16 49.9 50.2 49.9 Reconstructed X-Bar 50 20 50.2 50.3 499 50 195 495 50 6896 50 50.3 Average:5022 50 71 49.725 25 0.6784 1 548 Range Chart 0.729 2.282 99.9204 D4 There were a handful of points that were out of control due to assignable causes. These points inthe subgroup were poins: 2,3,4,14&23. The reconstructed chart above has the data point removed shows a chart that is in contral. 9,7254 elow are X and R values for 25 samples of size are made on the fill weight of the bags in Subgroup Number X Variable Contr kenfrom a process illing bags of fertilizer. The Set up the X and R charts on t process seem to be in control? W essary, assume assignable caus control limits. 5. Describe how both an X and R they were under normal statist 6. Why is the use and interpreta critical when examining an X 7. Create an X and R chart for t in Table 18.1 on page 000. Y range values for each subg limits and centerline for eac the calculated values. Begi Ran 50.3 0.73 49.6 0.75 50.8 0.79 50.9 0.74 49.8 0.72 50.5 0.73 50.2 0.71 49.9 0.70 50.0 0.65 50.1 0.67 50.2 0.65 50.5 0.67 50.4 0.68 50.8 0.70 50.0 0.65 49.9 0.66 50.4 0.67 50.5 0.68 50.7 0.70 50.2 0.65 49.9 0.60 50.1 0.64 49.5 0.60 50.0 0.62 50.3 0.60 2 6 does the process look? 10 8. RM Manufacturing make medical field. These the grees Celsius, are able level of precision of tw 12 13 Manufacturing tests mometers in a solution ature of 3C. Use th 17 interpret an X and R mometer reading of plotted averages and 19 20 21 Subgroup 23 24 25 Set up the X and R charts on this process. Interpret the charts. Does the process seem to be in control? If neces- sary, assume assignable causes and revise the trial con- tol limits, If the average fill of the bags is to be 50.0 4 pounds, how does this process compare? Inualues for 12 samples of T Original >Reconstructed Xbar Xbar UCL xbar LCL Range UC Rangle LC xbar CL Range AvE Reconstri Reconstru xbar LCL Sub Group Xbar Xbar Range UCL LCL Range Avs CL 0.7350.7 49.725 1.548 0.75 50.71 497251.548 0.79 507 49.725 1.548 0.74 50.71 497251.548 5 49.849.9 0.72 50.71 49.725 1.548 50 0.73 50.71 49.725 1.548 071 50.71 49.725 1.548 0.7 50.71 49.7251.548 0.65 507 49.725 1.548 10 50.1 50.407 50.71 49.725 1.548 0.65 507 49.725 1.548 50.5 49.975071 49.7251.548 0.68 507 49725 1548 0.7 50.71 49.7251.548 0.65 507 49.725 1.548 0.66 50.71 725 1.548 0.67 507 49.725 1.548 18 50.5 50.1 0.8 50.71 725 1.548 0.7 50.71 49.725 1.548 0.65 50.71 9725 1.548 06 50.71 49.725 1.548 50.1 49.7004 0.0.71 49725 1.548 06 50.71 49.725 1,548 0.62 50.71 9725 1.548 06 50,71 49.725 1548 50.3 49.649.8 50.8 50.9 50.3 0 50.22 0.6784 50.2 50.7 X-Bar Chart 2 0 50.22 0.6784 50.22 0.6784 0 50.22 0.6784 0 50.22 0.6784 0 50.22 0.6784 0 50.22 0.6784 0 50.22 0.6784 0 50.22 0.6784 0 50.22 0.6784 0 50.22 0.6784 0 50.22 0.6784 50.22 0.6784 0 50.22 0.6784 0 50.22 0.6784 0 50.22 0.6784 50.22 0.6784 0 50.22 0.6784 50 22 0.6784 0 50.22 0.6784 50 22 0,6784 0 50.22 0.6784 50 22 0.6784 0 50.22 0.6784 50 22 0,6784 50.5 50.2 51 0.74 50 71 Process not in control, will need to be revised/reconstructed. Points lying outside the control limits (2,3,4,14&23) 50.5 50.1 49.9 50 50.5 50 49.73 14 50.8 50.5 50 50.7 16 49.9 50.2 49.9 Reconstructed X-Bar 50 20 50.2 50.3 499 50 195 495 50 6896 50 50.3 Average:5022 50 71 49.725 25 0.6784 1 548 Range Chart 0.729 2.282 99.9204 D4 There were a handful of points that were out of control due to assignable causes. These points inthe subgroup were poins: 2,3,4,14&23. The reconstructed chart above has the data point removed shows a chart that is in contral. 9,7254 elow are X and R values for 25 samples of size are made on the fill weight of the bags in Subgroup Number X Variable Contr kenfrom a process illing bags of fertilizer. The Set up the X and R charts on t process seem to be in control? W essary, assume assignable caus control limits. 5. Describe how both an X and R they were under normal statist 6. Why is the use and interpreta critical when examining an X 7. Create an X and R chart for t in Table 18.1 on page 000. Y range values for each subg limits and centerline for eac the calculated values. Begi Ran 50.3 0.73 49.6 0.75 50.8 0.79 50.9 0.74 49.8 0.72 50.5 0.73 50.2 0.71 49.9 0.70 50.0 0.65 50.1 0.67 50.2 0.65 50.5 0.67 50.4 0.68 50.8 0.70 50.0 0.65 49.9 0.66 50.4 0.67 50.5 0.68 50.7 0.70 50.2 0.65 49.9 0.60 50.1 0.64 49.5 0.60 50.0 0.62 50.3 0.60 2 6 does the process look? 10 8. RM Manufacturing make medical field. These the grees Celsius, are able level of precision of tw 12 13 Manufacturing tests mometers in a solution ature of 3C. Use th 17 interpret an X and R mometer reading of plotted averages and 19 20 21 Subgroup 23 24 25 Set up the X and R charts on this process. Interpret the charts. Does the process seem to be in control? If neces- sary, assume assignable causes and revise the trial con- tol limits, If the average fill of the bags is to be 50.0 4 pounds, how does this process compare? Inualues for 12 samples of T