Answered step by step
Verified Expert Solution
Question
1 Approved Answer
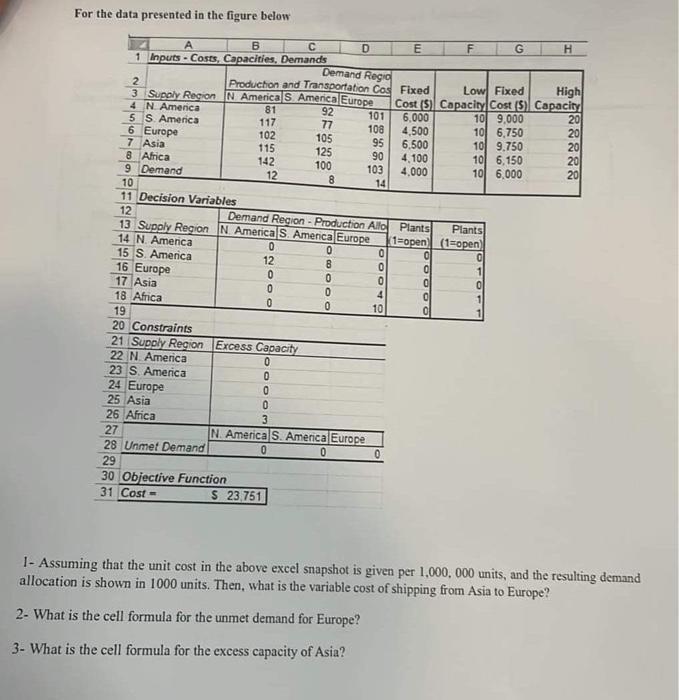
For the data presented in the figure below A B C 1 Inputs-Costs, Capacities, Demands 2 3 Supply Region 4 N America S. America

For the data presented in the figure below A B C 1 Inputs-Costs, Capacities, Demands 2 3 Supply Region 4 N America S. America 5 6 Europe 7 Asia Demand Regio Production and Transportation Cos N America S America Europe 81 117 102 115 142 8 Africa 9 Demand 10 11 Decision Variables 12 13 Supply Region 14 N. America 15 S. America 16 Europe 17 Asia 18 Africa 19 20 Constraints 21 Supply Region Excess Capacity 22 N. America 23 S. America 24 Europe 25 Asia 26 Africa 27 28 Unmet Demand 29 30 Objective Function 31 Cost- 12 S 23,751 12 92 77 105 60030 125 100 8 OOOOO 8 Demand Region - Production Allo Plants N. America S. America Europe 0 0 D 0 0 N. America S. America Europe 0 0 101 108 95 90 103 14 70040 10 E 0 6,000 4,500 6,500 4,100 4,000 Fixed Low Fixed High Cost (5) Capacity Cost (5) Capacity 20 F OOOOO G 10 9,000 10 6,750 10 9.750 Plants (1-open) (1-open) 10 6,150 10 6,000 0 1 0 1 H 88888 20 20 20 20 1- Assuming that the unit cost in the above excel snapshot is given per 1,000, 000 units, and the resulting demand allocation is shown in 1000 units. Then, what is the variable cost of shipping from Asia to Europe? 2- What is the cell formula for the unmet demand for Europe? 3- What is the cell formula for the excess capacity of Asia?
Step by Step Solution
★★★★★
3.43 Rating (159 Votes )
There are 3 Steps involved in it
Step: 1
1 The variable cost of shipping from ...
Get Instant Access to Expert-Tailored Solutions
See step-by-step solutions with expert insights and AI powered tools for academic success
Step: 2

Step: 3

Ace Your Homework with AI
Get the answers you need in no time with our AI-driven, step-by-step assistance
Get Started


