Answered step by step
Verified Expert Solution
Link Copied!

Question

1 Approved Answer

For the fiscal period in the screenshot, I need the Market Capitalization, Market to Book and Price Earnings Ratio. Please label as such and I

For the fiscal period in the screenshot, I need the Market Capitalization, Market to Book and Price Earnings Ratio. Please label as such and I will give positive rating immediately! Thank you =) Also, share price is today's current share price. Which is $237.96 by a quick google! image text in transcribed

2021 2021 2021 2021 2021 2020 2020 2020 2020 2020 ($ in millions, except per share data) Q1 % chng Q2 % chng Q3 % chng Q4 % chng Year % chng Q1 Q2 Q3 Q4 Year Revenue 6,805.6 16 % 6.740.1 23 % 13.545.7 19 % 5,859.8 5,499.4 5,740.6 7,440.0 24,539.8 Cost of sales Gross margin % of total revenue 1,878.6 4,927.0 55 % 6 % 1,953.2 4,786.9 60 % 12 % 3,831.8 9,713.9 57 % 9 % 1,215.1 4,644.7 1,222.0 4.277.4 1,326.4 4.414.2 1,719.8 5,720.2 5,483.3 19,056.5 72.4 % 71.0 % 71.7 % 79.3 % 77.8 % 76.9% 76.9% 77.7 % 21 % 20 % 21 % Research and development % of total revenue 1,684.8 24.8 % 1,672.8 24.8 % 3,357.6 24.8 % 1,392.1 23.8 % 1,390.2 25.3 % 1,465.4 25.5 % 1,838.0 24.7 % 6,085.7 24.8 % Marketing, selling and administrative 1,576.0 2 % 1,685.7 16 % 3,261.7 9% 1,549.6 1,448.6 1,569.1 1,553.9 6,121.2 Acquired in-process research and development 299.3 NM 25.0 (90)% 324.3 10 % 52.3 241.8 366.3 660.4 Asset impairment, restructuring, and other special charges Operating income 211.6 NM 211.6 1,155.3 NM (27)% NM 17 % 59.9 1,590.8 101.4 1,278.3 (30.1) 1,992.1 131.2 6,058.0 1,403.4 2,558.7 (8)% 1,196.8 Interest, net Other income Other - net, income (expense) (82.3) 403.4 321.1 (81.5) 272.0 190.5 (163.8) 675.4 511.6 (78.2) 167.3 89.1 (81.2) 528.1 446.9 (83.8) 242.7 158.9 (83.4) 560.4 477.0 (326.6) 1,498.5 1,171.9 NM (57)% (5)% Income before income taxes 1,476.4 (12) 1,593.9 (3)% 3,070.3 (8)% 1,679 1,643.7 137.2 2,469.1 7,229.9 (46)% (12)% 324.8 (29)% 352.3 Income tax expense (benefit) Effective tax rate 121.1 8.2 % 203.7 12.8 % 223.4 13.3 % 231.7 14.1 % 228.8 15.9 % 1,036.2 14.3 % 10.6 % 14.3 % Net income 1.355.3 (7)% 1,390.2 (2)% 2,745.5 (4)% 1,456.5 1,412.0 1,208.4 2,116.8 6,193.7 Earnings per share 1.49 (7)% 1.53 (1)% 3.01 (4)% 1.60 1.55 1.33 2.32 6.79 Diluted shares outstanding (thousands) 912,419 - % 910,384 % 911,623 911,713 910,890 911,423 912,591 912,505 Note: Numbers may not add due to rounding

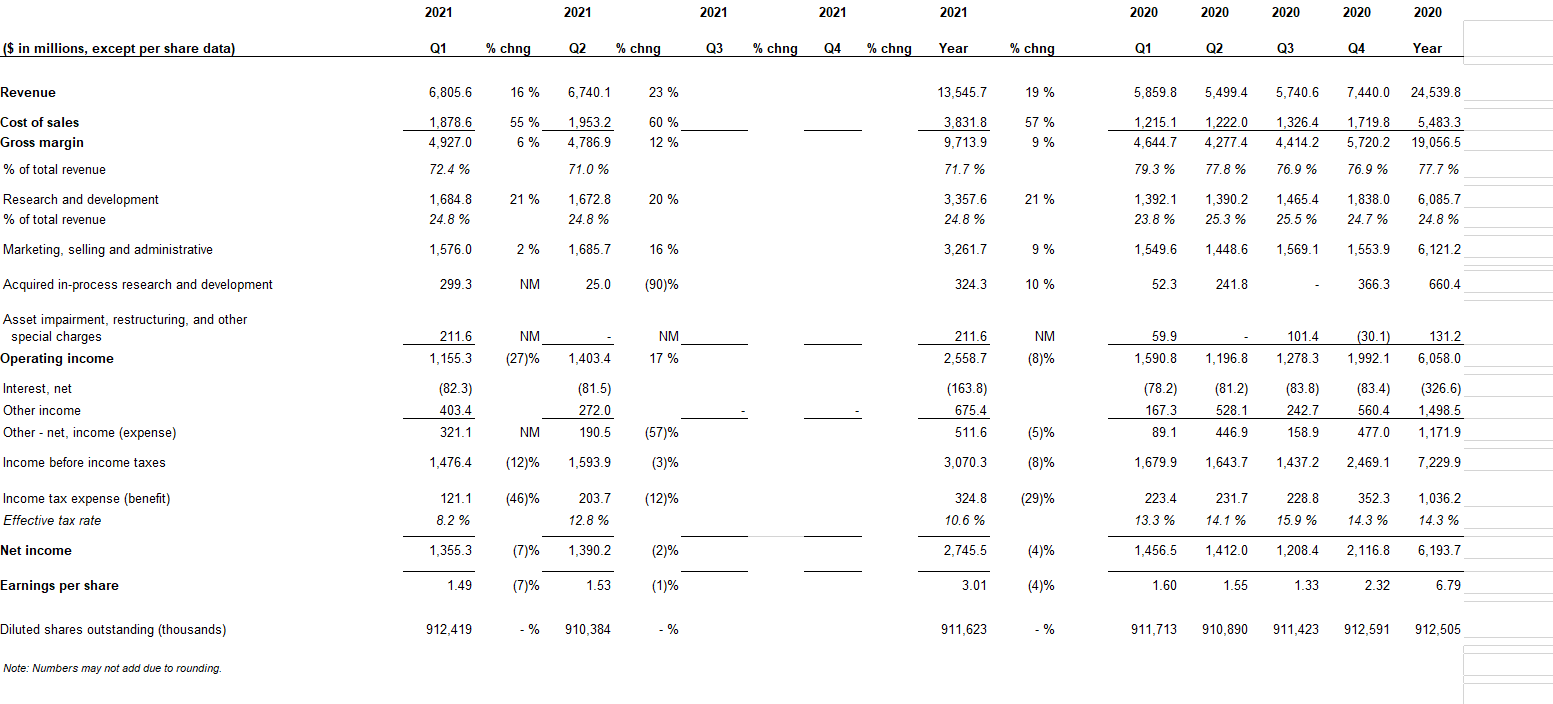
Step by Step Solution

There are 3 Steps involved in it

Step: 1

blur-text-image

Get Instant Access to Expert-Tailored Solutions

See step-by-step solutions with expert insights and AI powered tools for academic success

Step: 2

blur-text-image

Step: 3

blur-text-image

Ace Your Homework with AI

Get the answers you need in no time with our AI-driven, step-by-step assistance

Get Started

Recommended Textbook for

Foreign Investment And Spillovers

Authors: Magnus Blomstrom

1st Edition

1138025976,1317685121

More Books

Students also viewed these Finance questions