Question
For the following data, what is the current number of significant figures for the y-intercept? How would you report the y-intercept in the text

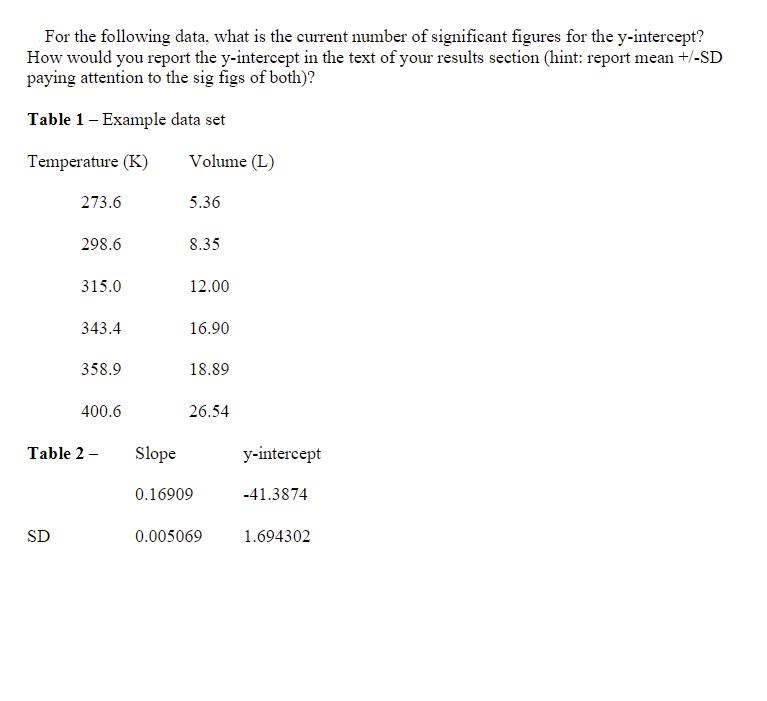
For the following data, what is the current number of significant figures for the y-intercept? How would you report the y-intercept in the text of your results section (hint: report mean +/-SD paying attention to the sig figs of both)? Table 1 - Example data set Temperature (K) 273.6 SD 298.6 315.0 343.4 358.9 400.6 Table 2- Slope Volume (L) 5.36 8.35 12.00 16.90 18.89 26.54 0.16909 0.005069 y-intercept -41.3874 1.694302
Step by Step Solution
3.29 Rating (149 Votes )
There are 3 Steps involved in it
Step: 1
Solut...
Get Instant Access to Expert-Tailored Solutions
See step-by-step solutions with expert insights and AI powered tools for academic success
Step: 2

Step: 3

Ace Your Homework with AI
Get the answers you need in no time with our AI-driven, step-by-step assistance
Get StartedRecommended Textbook for
University Physics with Modern Physics
Authors: Hugh D. Young, Roger A. Freedman, Lewis Ford
12th Edition
978-0321501479, 9780805321876, 321501470, 978-0321501219
Students also viewed these Mathematics questions
Question
Answered: 1 week ago
Question
Answered: 1 week ago
Question
Answered: 1 week ago
Question
Answered: 1 week ago
Question
Answered: 1 week ago
Question
Answered: 1 week ago
Question
Answered: 1 week ago
Question
Answered: 1 week ago
Question
Answered: 1 week ago
Question
Answered: 1 week ago
Question
Answered: 1 week ago
Question
Answered: 1 week ago
Question
Answered: 1 week ago
Question
Answered: 1 week ago
Question
Answered: 1 week ago
Question
Answered: 1 week ago
Question
Answered: 1 week ago
Question
Answered: 1 week ago
Question
Answered: 1 week ago
Question
Answered: 1 week ago
View Answer in SolutionInn App


