Answered step by step
Verified Expert Solution
Question
1 Approved Answer
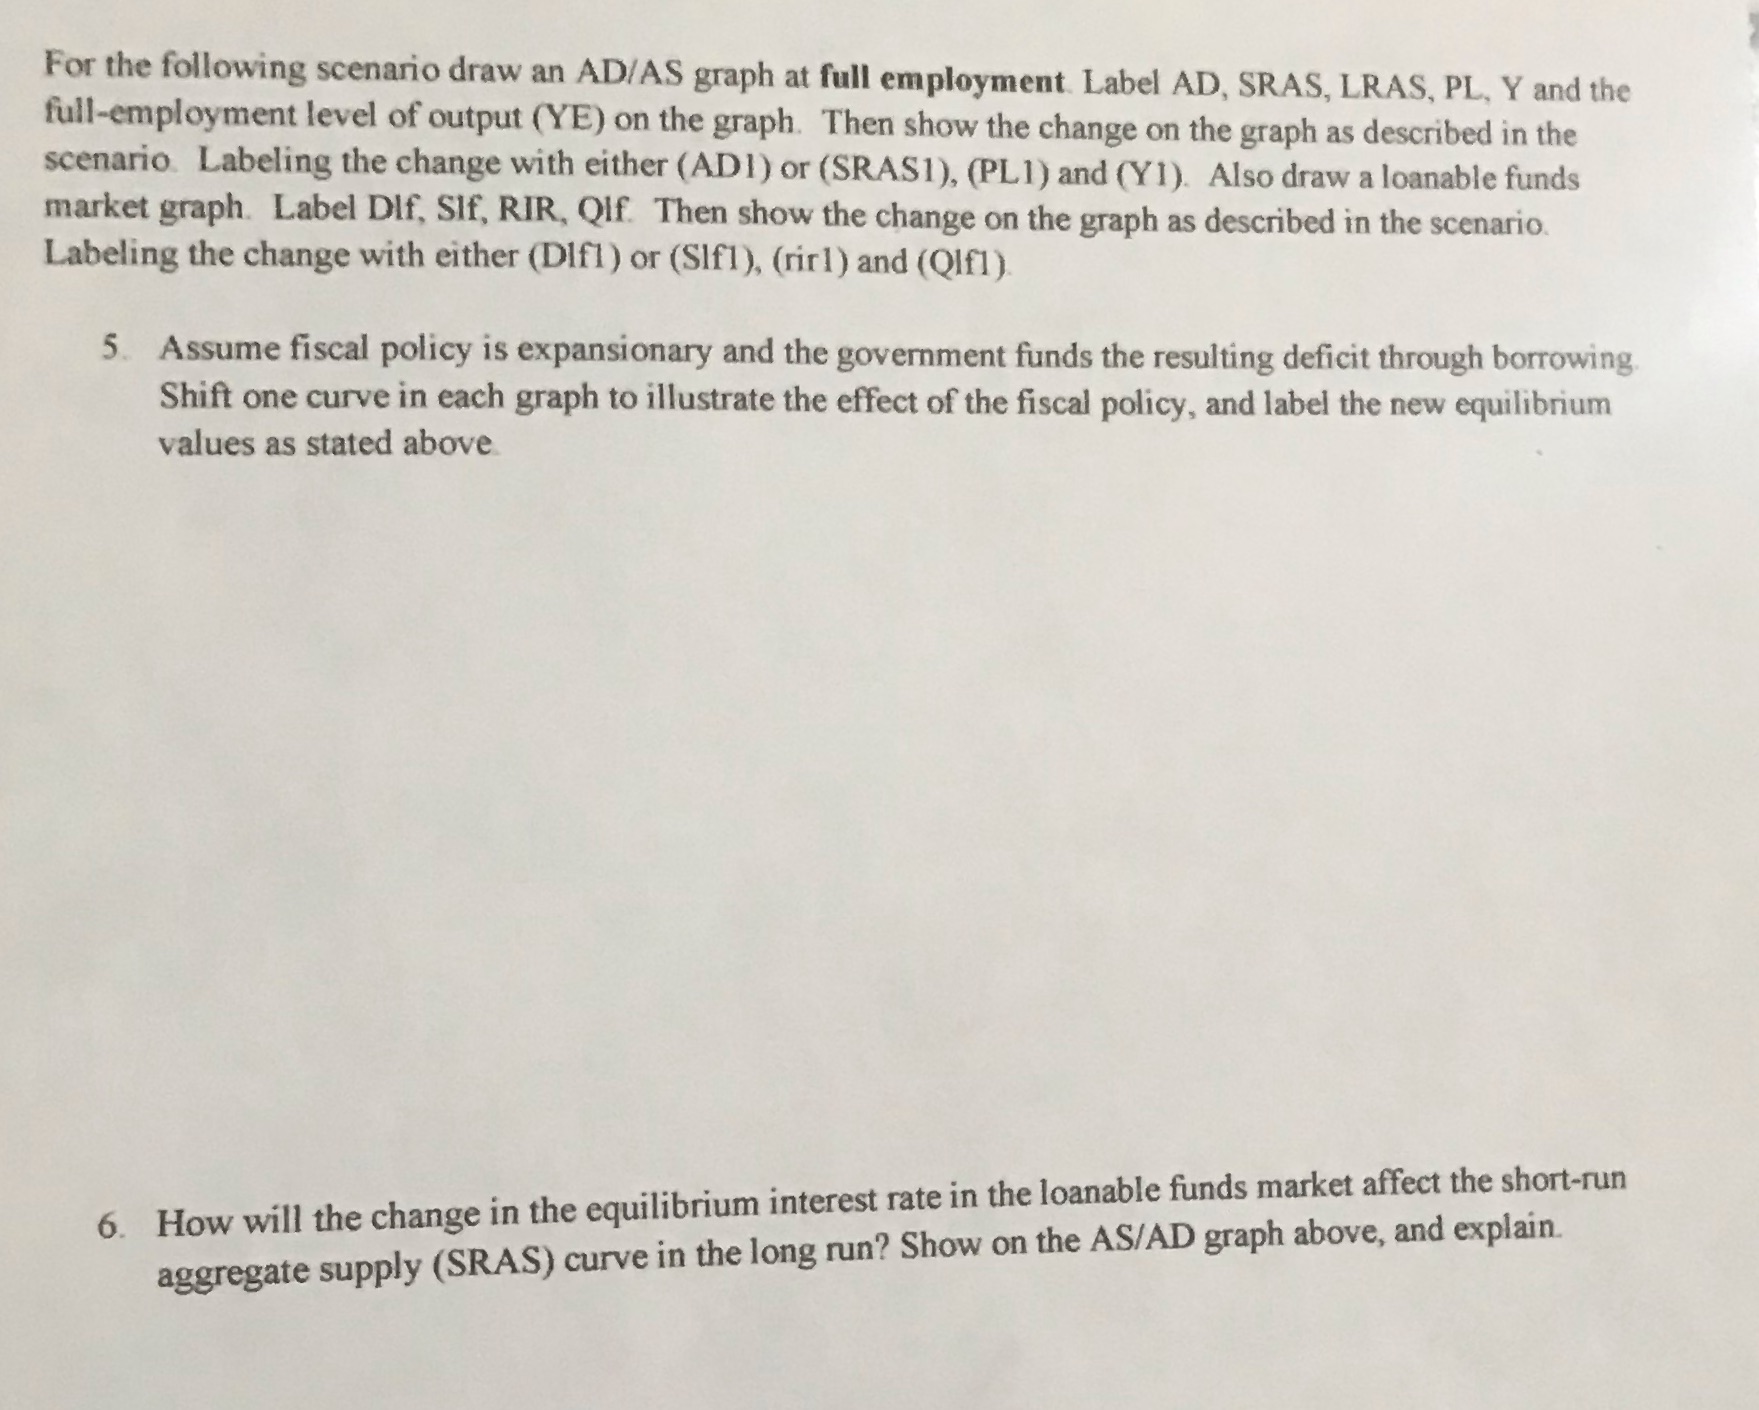
For the following scenario draw an AD/AS graph at full employment Label AD, SRAS, LRAS, PL, Y and the full-employment level of output (YE)

For the following scenario draw an AD/AS graph at full employment Label AD, SRAS, LRAS, PL, Y and the full-employment level of output (YE) on the graph. Then show the change on the graph as described in the scenario. Labeling the change with either (ADI) or (SRAS1), (PL1) and (Y1). Also draw a loanable funds market graph. Label Dlf, Slf, RIR, Qlf. Then show the change on the graph as described in the scenario. Labeling the change with either (Dlfl) or (Slf1), (rirl) and (Qlfl). 5. Assume fiscal policy is expansionary and the government funds the resulting deficit through borrowing. Shift one curve in each graph to illustrate the effect of the fiscal policy, and label the new equilibrium values as stated above 6. How will the change in the equilibrium interest rate in the loanable funds market affect the short-run aggregate supply (SRAS) curve in the long run? Show on the AS/AD graph above, and explain.
Step by Step Solution
There are 3 Steps involved in it
Step: 1
The instructions youve provided are for drawing an Aggregate DemandAggregate Supply ADAS graph and a loanable funds market graph to illustrate the imp...
Get Instant Access to Expert-Tailored Solutions
See step-by-step solutions with expert insights and AI powered tools for academic success
Step: 2

Step: 3

Ace Your Homework with AI
Get the answers you need in no time with our AI-driven, step-by-step assistance
Get Started


