Question
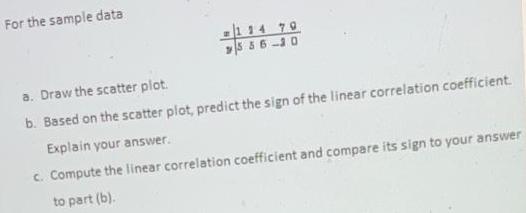
For the sample data 114 70 5 56 -10 a. Draw the scatter plot. b. Based on the scatter plot, predict the sign of

For the sample data 114 70 5 56 -10 a. Draw the scatter plot. b. Based on the scatter plot, predict the sign of the linear correlation coefficient. Explain your answer. c. Compute the linear correlation coefficient and compare its sign to your answer to part (b).
Step by Step Solution
3.50 Rating (153 Votes )
There are 3 Steps involved in it
Step: 1
Answer Solution 1 a The scatter plot of the data is as shown bel...
Get Instant Access to Expert-Tailored Solutions
See step-by-step solutions with expert insights and AI powered tools for academic success
Step: 2

Step: 3

Ace Your Homework with AI
Get the answers you need in no time with our AI-driven, step-by-step assistance
Get StartedRecommended Textbook for
Operations Management Creating Value Along the Supply Chain
Authors: Roberta S. Russell, Bernard W. Taylor
7th Edition
9781118139523, 0470525908, 1118139526, 978-0470525906
Students also viewed these Accounting questions
Question
Answered: 1 week ago
Question
Answered: 1 week ago
Question
Answered: 1 week ago
Question
Answered: 1 week ago
Question
Answered: 1 week ago
Question
Answered: 1 week ago
Question
Answered: 1 week ago
Question
Answered: 1 week ago
Question
Answered: 1 week ago
Question
Answered: 1 week ago
Question
Answered: 1 week ago
Question
Answered: 1 week ago
Question
Answered: 1 week ago
Question
Answered: 1 week ago
Question
Answered: 1 week ago
Question
Answered: 1 week ago
Question
Answered: 1 week ago
Question
Answered: 1 week ago
Question
Answered: 1 week ago
Question
Answered: 1 week ago
Question
Answered: 1 week ago
Question
Answered: 1 week ago
Question
Answered: 1 week ago
View Answer in SolutionInn App


