Question
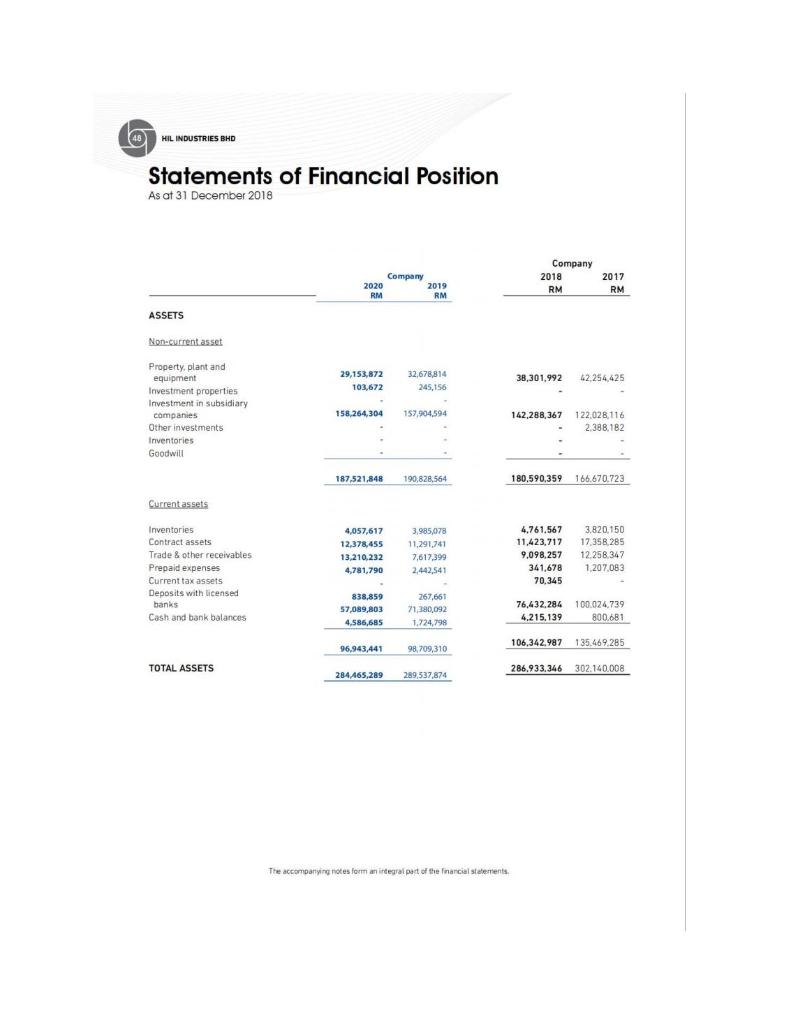
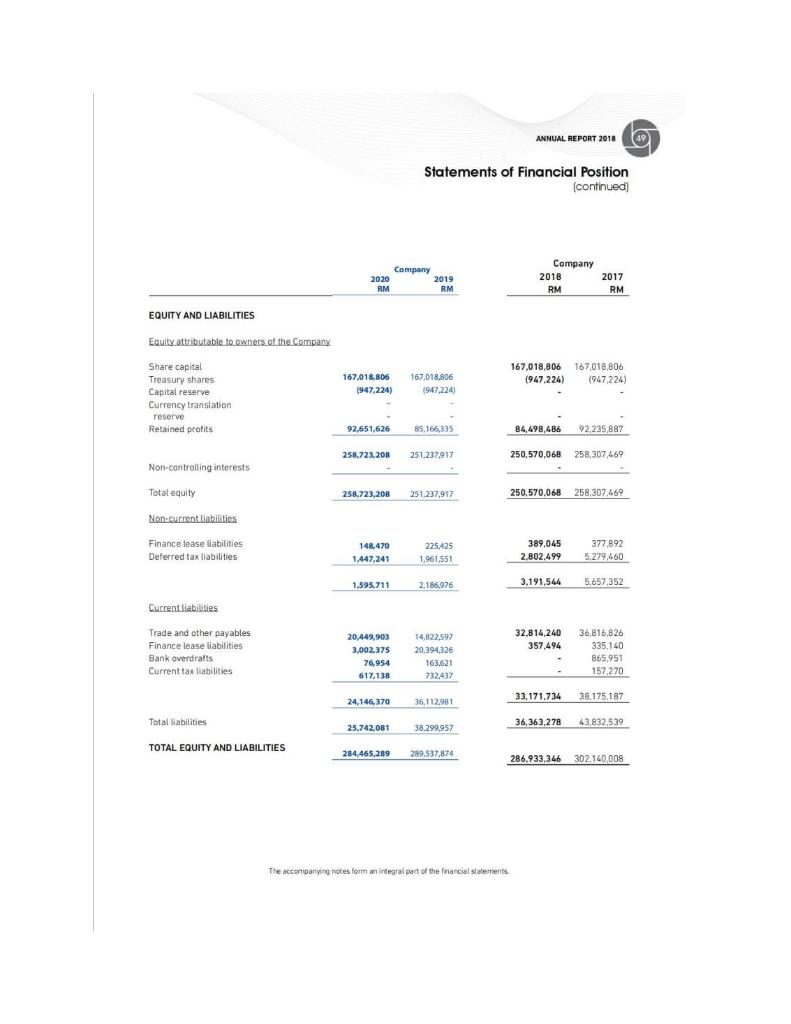
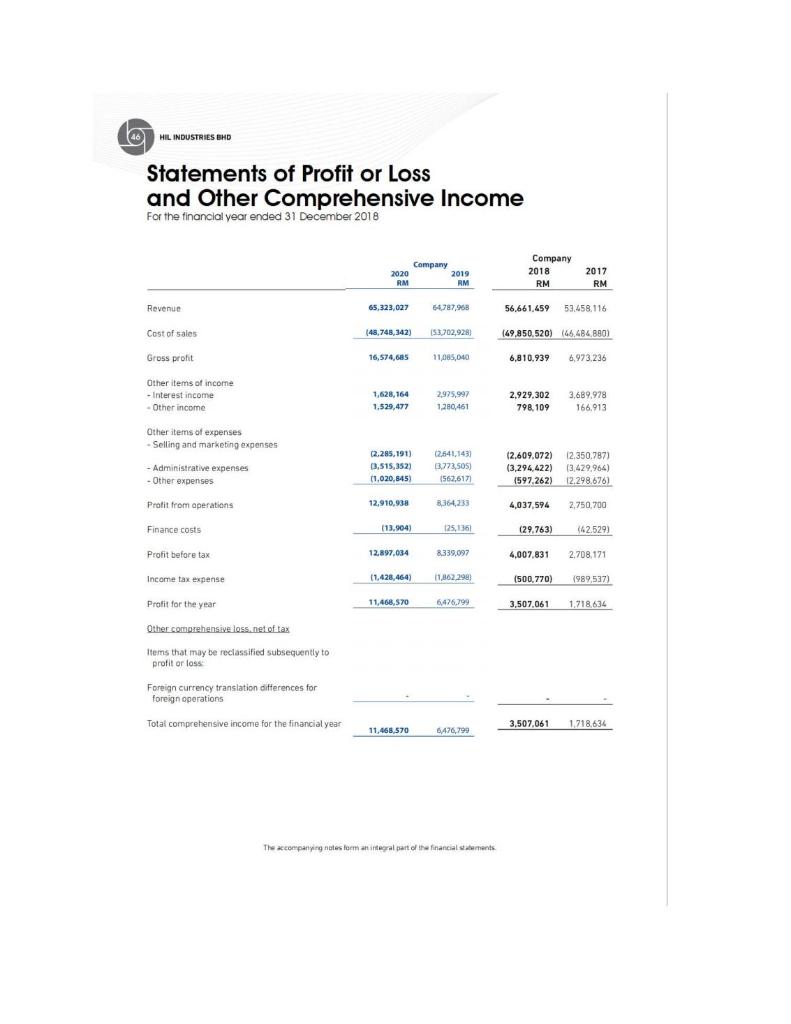
For the year 2017 find Liquidity Ratios: Current Ratio=(Current Assets/Current Liabilities) Quick Ratio=(Current Assets- Inventory/Current Liabilities) Cash Ratio=(Cash And Cash Equivalents/Current Liabilities) 2.Asset Management ratios


For the year 2017 find
- Liquidity Ratios:
Current Ratio=(Current Assets/Current Liabilities)
Quick Ratio=(Current Assets- Inventory/Current Liabilities)
Cash Ratio=(Cash And Cash Equivalents/Current Liabilities)
2.Asset Management ratios
Inventory Turnover (Cost of Revenue/ Inventory)
Average collection period (365/Average Accounts Receivable)
Average payment period (365/Average Accounts Payable)
3.Debt Management Ratios:
Debt To Equity Ratio
Debt Ratio
4.Profitability Ratios:
Net Profit (Earnings) Margin (Net Earnings/Revenue)
Return On Assets (ROA) (Net Earnings/Total Assets)
Return On Equity (ROE)(Net Earnings/(Shareholders' Equity - Other Share Capital))
- Market Value Ratios share price RM0.835 NO. OF SHARES=331940812 EPS=0.406
Price earning ratio
Market to book ratio
6. DuPont Formula
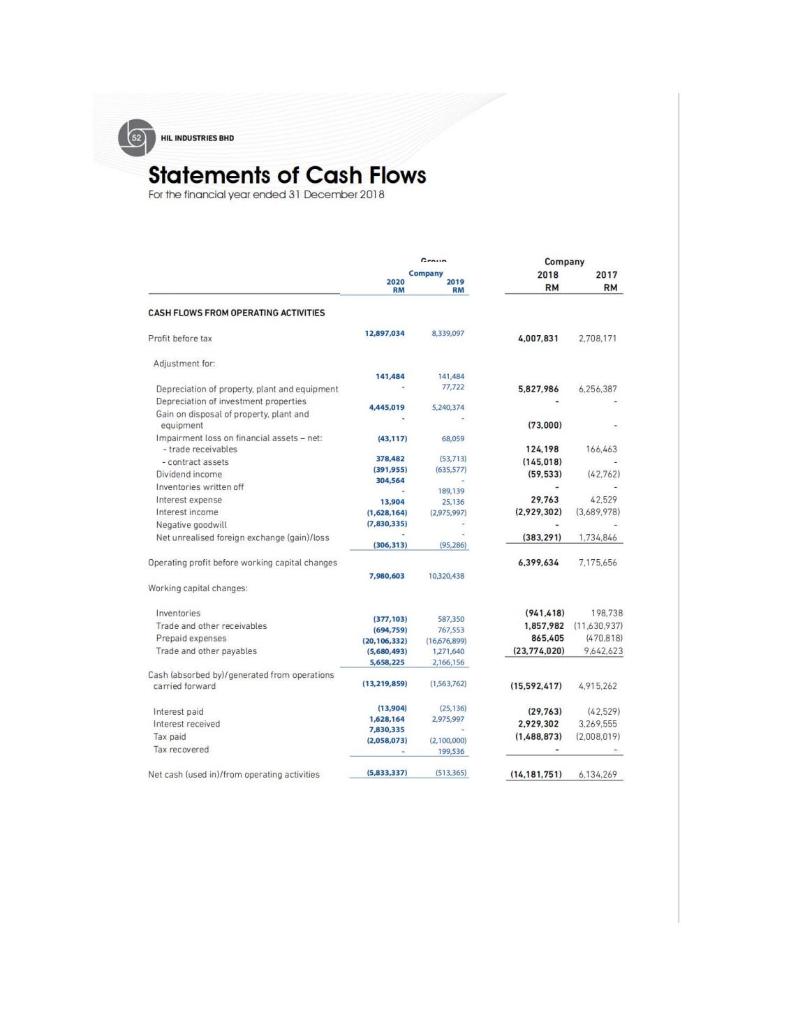
48 HIL INDUSTRIES BHD Statements of Financial Position As at 31 December 2018 Company 2020 2019 RM RM Company 2018 RM 2017 RM ASSETS Non-current asset 29,153,872 103,672 32,678,814 245,156 38,301,992 42,254 425 Property, plant and equipment Investment properties Investment in subsidiary companies Other investments Inventories Goodwill 158,264,304 157,904,594 142,288,367 122.028,116 2.388,182 187,521,848 190,828,564 180,590,359 166.670.723 Current assets Inventories Contract assets Trade & other receivables Prepaid expenses Current tax assets Deposits with licensed 4,057,617 12,378,455 13,210,232 4.781,790 3,985,078 11.291,741 7,617,399 2.442,541 4,761,567 11,423,717 9,098.257 341,678 70,345 3.820,150 17358.285 12258.347 1,207,083 banks 838,859 57,089,803 4,586,685 267,661 71,380,092 1.724,798 76,432,284 4,215,139 Cash and bank balances 100.024.739 800.681 106.342.987 135.469.285 96,943,441 98.709.310 TOTAL ASSETS 286.933.346 302.140.008 284 465.289 289,537,874 The accompanying notes for an integral part of the financial statements ANNUAL REPORT 2018 Statements of Financial Position ( (continued) Company 2020 2019 RM RM Company 2018 RM 2017 RM EQUITY AND LIABILITIES Equity attributable to owners of the Company 167,018,806 167.018,806 1947,224) 1947,224) 167,018,806 1947,224) 167,018,806 1947.224) Share capital Treasury shares Capital reserve Currency translation reserve Retained profits 92.651.626 85.166,335 84,498,486 92,235,887 258,723,200 251.237917 250,570,068 258.307,469 Non-controlling interests Totat equity 258,723,208 251,237,917 250.570,068 258.307,469 Non-current liabilities Finance lease liabilities Deferred tax liabilities 148.470 1,447,241 225425 1.961.551 389.045 2.802,499 377,892 5.279,460 1,595,711 2.186,976 3,191,544 5,657,352 Current liabilities Trade and other payables Finance lease liabilities Bank overdrafts Current tax liabilities 32,814,240 357.494 20,449,903 3.002.375 76,954 617,138 14,822,597 20,394,326 163,621 732437 36,816,826 335,140 865.951 157.270 24,146,370 36,112,981 33,171.734 38.175.187 Total liabilities 25.742081 38.299.957 36,363,278 43.832,539 TOTAL EQUITY AND LIABILITIES 284465,289 289,537,874 286.933,346 302,140,008 The accompanying notes for an integral part of the financial statements HIL INDUSTRIES BHD Statements of Cash Flows For the financial year ended 31 December 2018 Company Company 2018 RM 2020 RM 2019 RM 2017 RM CASH FLOWS FROM OPERATING ACTIVITIES Profit before tax 12,897034 339.097 4,007,831 2,708,171 Adjustment for 141,484 141.484 77,722 5,827,986 6,256,387 4,445.019 5.240.374 173.000) (43,117) 68.059 166,463 Depreciation of property, plant and equipment Depreciation of investment properties Gain on disposat of property, plant and equipment Impairment loss on financial assets-net - trade receivables - contract assets Dividend income Inventories written off Interest expense Interest income Negative goodwill Net unrealised foreign exchange gain)/oss 378,482 (391,955) 304.564 (53,7131 (635.5771 124, 198 (145,018) (59.533) (42,762) 13,904 11,628,164) 17,830,3351 189,139 25.136 12.975,997 29.763 12,929,302) 42,529 3,689,978) (383,291) 1.734,846 (306,313) 195.286 Operating profit before working capital changes 6.399,634 7,175,656 7,960,603 10.320.438 Working capital changes Inventories Trade and other receivables Prepaid expenses Trade and other payables (377,103) (694,7591 120,106,332) (5,680,4933 5,658.225 587,350 767,553 (16676,8991 1,271,640 2,166,156 (941,418) 1 98.738 1,857,982 (11.630.937) 865.405 1470,818) 123,774,020) 9,642.623 Cash absorbed by/generated from operations Carried forward (13.219,859) ) 11,563,762) (15,592,417) 4,915,262 (25,1361 2925 997 Interest paid Interest received Tax paid Tax recovered (13,904) 1,628,164 7,830,335 (2,058,0731 (29.763) 2,929,302 (1.488.873) (42,529) 3.269,555 12.008.019) (2.100.000 199,536 Net cash (used in/from operating activities (5.833.337) (513365) (14,181.751) ) 6.134,269 46 HIL INDUSTRIES BHD Statements of Profit or Loss and Other Comprehensive Income For the financial year ended 31 December 2018 2020 RM Company 2019 RM Company 2018 RM 2017 RM Revenue 65,323,027 54.787,98 56.661.459 53,458,116 148,748.3421) 53.702,928) (49,850.520) (66,486,880) (( Cost of sales Gross profit 16,574,685 11085, 040 6,810.939 6,973.236 Other items of income - Interest income - Other income 1,628,164 1.529,477 2,975,997 1,280,461 2.929.302 798,109 3,639.978 166.913 Other items of expenses Selling and marketing expenses - Administrative expenses - Other expenses (2.285,191) 3,515,352) 11,020,845 (2641,1431 3,772,505) 1562,617 (2.609.072) 12.350.787) (3.294,422) (3,429.964) 1597,262) 12.298.676) 12,910,938 B364,233 4,037,596 2,750.700 Pratit from operations Finance costs (13.904) 125, 1361 (29.763) ( 162.529) Profit before tax 12,897,034 8.339,097 4,007.831 2.708.121 Income tax expense (1,428,464) 11,362298) (500.770 1989,537) Profit for the year 11,468,570 6476.799 3,507.061 1.718.634 Other comprehensive loss.net of tax Items that may be reclassified subsequently to profit or loss Foreign currency translation differences for foreign operations Total comprehensive income for the financial year 3.507.061 1,718.634 11,468 570 6476,799 The accompanying notes for an integral part of the financial statementsStep by Step Solution
There are 3 Steps involved in it
Step: 1

Get Instant Access to Expert-Tailored Solutions
See step-by-step solutions with expert insights and AI powered tools for academic success
Step: 2

Step: 3

Ace Your Homework with AI
Get the answers you need in no time with our AI-driven, step-by-step assistance
Get Started


