For this activity, imagine that you are considering investment in an existing company. Look at the income statement for Canada Hardware and decide if this business is worth consideration. Make note of anything in the financial statements that strikes you as a red flag or serious risk. Consider your own interest in buying a business and what "value" you would expect from it before contributing your post.
State why you would, or would not be interested in further investigation into this business so that we understand the "value" you are looking for.
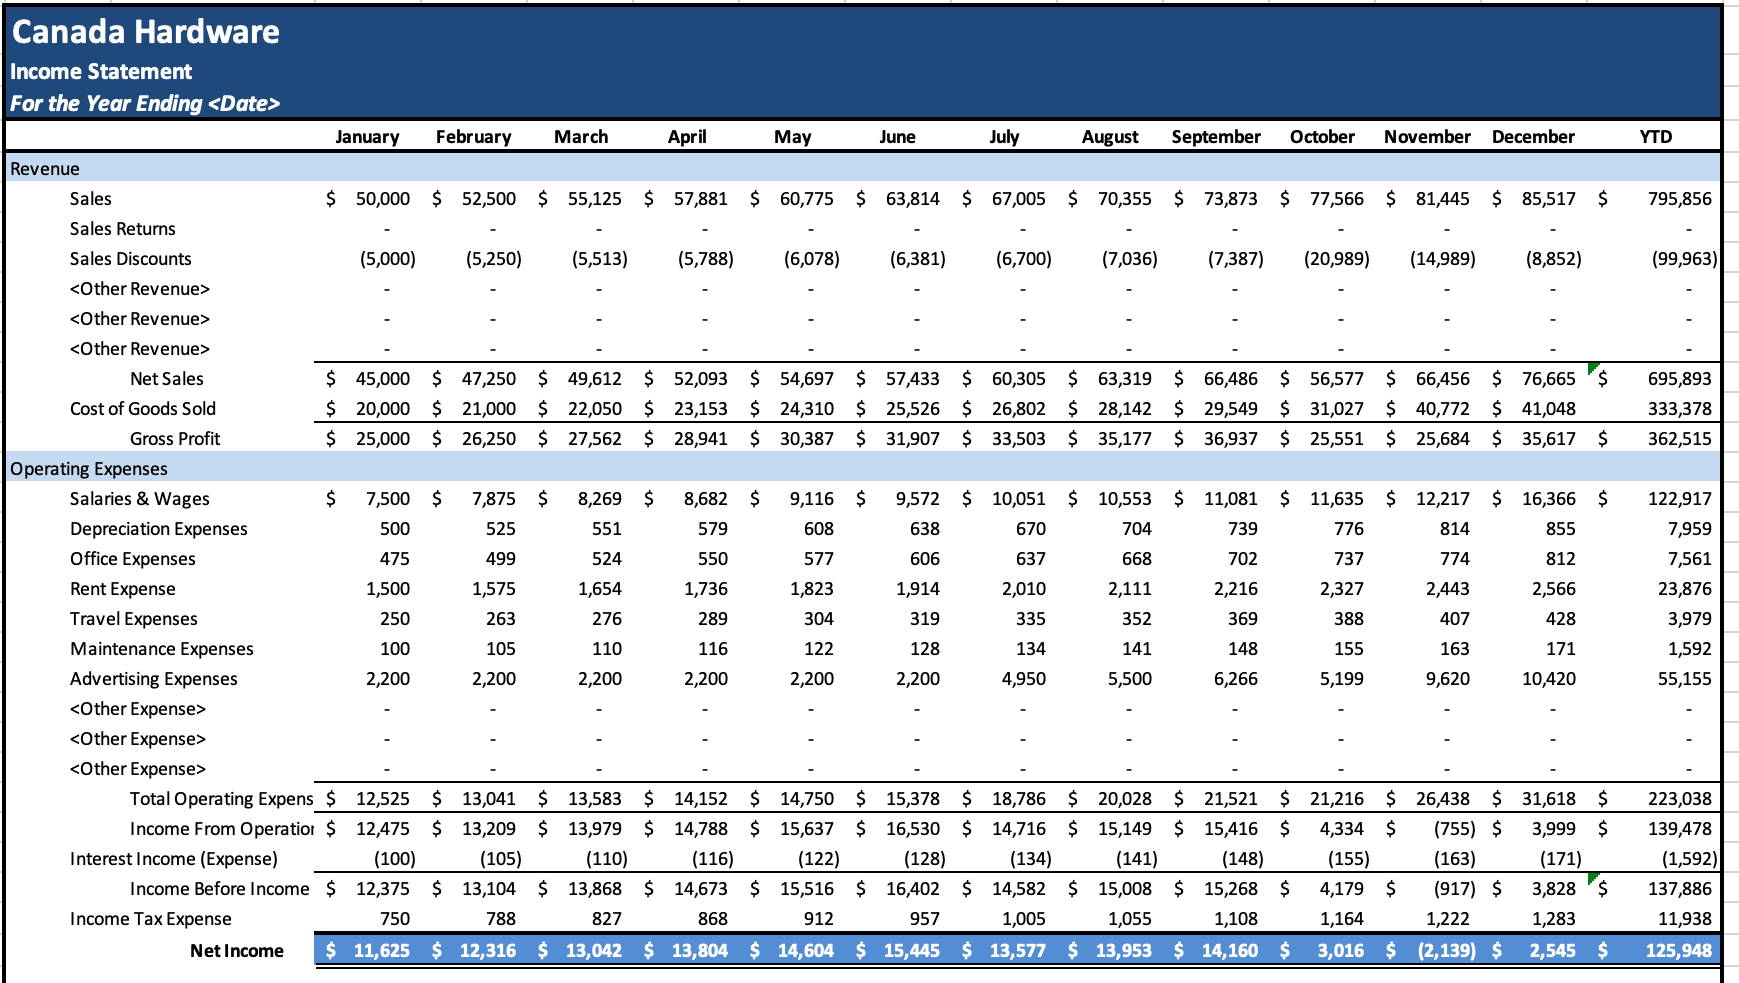
Canada Hardware Income Statement For the Year Ending
January February March April May June July August September October November December YTD Revenue Sales $ 50,000 $ 52,500 $ 55,125 $ 57,881 $ 60,775 $ 63,814 $ 67,005 $ 70,355 $ 73,873 $ 77,566 $ 81,445 $ 85,517 $ 795,856 Sales Returns Sales Discounts (5,000) (5,250) (5,513) (5,788) (6,078) (6,381) (6,700) (7,036) (7,387) (20,989) (14,989) (8,852) (99,963) 695,893 333,378 362,515 8,682 Net Sales $ 45,000 $ 47,250 $ 49,612 $ 52,093 $ 54,697 $ 57,433 $ 60,305 $ 63,319 $ 66,486 $ 56,577 $ 66,456 $ 76,665 $ Cost of Goods Sold $ 20,000 $ 21,000 $ 22,050 $ 23,153 $ 24,310 25,526 $ 26,802 $ 28,142 $ 29,549 $ 31,027 $ 40,772 $ 41,048 Gross Profit $ 25,000 $ 26,250 $ 27,562 $ 28,941 $ 30,387 $ 31,907 $ 33,503 $ 35,177 $ 36,937 $ 25,551 $ 25,684 $ 35,617 $ Operating Expenses Salaries & Wages $ 7,500 $ 7,875 $ 8,269 $ $ 9,116 $ 9,572 $ 10,051 $ 10,553 $ 11,081 $ 11,635 $ 12,217 $ 16,366 $ Depreciation Expenses 500 525 551 579 608 638 670 704 739 776 814 855 Office Expenses 475 499 524 550 577 606 637 668 702 737 774 812 Rent Expense 1,500 1,575 1,654 1,736 1,823 1,914 2,010 2,111 2,216 2,327 2,443 2,566 Travel Expenses 250 263 276 289 304 319 335 352 369 388 407 428 Maintenance Expenses 100 105 110 116 122 128 134 141 148 155 163 171 Advertising Expenses 2,200 2,200 2,200 2,200 2,200 2,200 4,950 5,500 6,266 5,199 9,620 10,420 Total Operating Expens $ 12,525 $ 13,041 $ 13,583 $ 14,152 $ 14,750 $ 15,378 $ 18,786 $ 20,028 $ 21,521 $ 21,216 $ 26,438 $ 31,618 Income From Operatio: $ 12,475 $ 13,209 $ 13,979 $ 14,788 $ 15,637 $ 16,530 $ 14,716 $ 15,149 $ 15,416 $ 4,334 $ (755) $ 3,999 $ Interest Income (Expense) (100) (105) (110) (116) (122) (128) (134) (141) (148) (155) (163) (171) Income Before Income $ 12,375 $ 13,104 $ 13,868 $ 14,673 $ 15,516 $ 16,402 $ 14,582 $ 15,008 $ 15,268 $ 4,179 $ (917) $ 3,828 $ Income Tax Expense 750 788 827 868 912 957 1,005 1,055 1,108 1,164 1,222 1,283 Net Income $ 11,625 $ 12,316 $ 13,042 $ 13,804 $ 14,604 $ 15,445 $ 13,577 $ 13,953 $ 14,160 $ 3,016 $ (2,139) $ 2,545 $ 122,917 7,959 7,561 23,876 3,979 1,592 55,155 223,038 139,478 (1,592) 137,886 11,938 125,948 Canada Hardware Income Statement For the Year Ending January February March April May June July August September October November December YTD Revenue Sales $ 50,000 $ 52,500 $ 55,125 $ 57,881 $ 60,775 $ 63,814 $ 67,005 $ 70,355 $ 73,873 $ 77,566 $ 81,445 $ 85,517 $ 795,856 Sales Returns Sales Discounts (5,000) (5,250) (5,513) (5,788) (6,078) (6,381) (6,700) (7,036) (7,387) (20,989) (14,989) (8,852) (99,963) 695,893 333,378 362,515 8,682 Net Sales $ 45,000 $ 47,250 $ 49,612 $ 52,093 $ 54,697 $ 57,433 $ 60,305 $ 63,319 $ 66,486 $ 56,577 $ 66,456 $ 76,665 $ Cost of Goods Sold $ 20,000 $ 21,000 $ 22,050 $ 23,153 $ 24,310 25,526 $ 26,802 $ 28,142 $ 29,549 $ 31,027 $ 40,772 $ 41,048 Gross Profit $ 25,000 $ 26,250 $ 27,562 $ 28,941 $ 30,387 $ 31,907 $ 33,503 $ 35,177 $ 36,937 $ 25,551 $ 25,684 $ 35,617 $ Operating Expenses Salaries & Wages $ 7,500 $ 7,875 $ 8,269 $ $ 9,116 $ 9,572 $ 10,051 $ 10,553 $ 11,081 $ 11,635 $ 12,217 $ 16,366 $ Depreciation Expenses 500 525 551 579 608 638 670 704 739 776 814 855 Office Expenses 475 499 524 550 577 606 637 668 702 737 774 812 Rent Expense 1,500 1,575 1,654 1,736 1,823 1,914 2,010 2,111 2,216 2,327 2,443 2,566 Travel Expenses 250 263 276 289 304 319 335 352 369 388 407 428 Maintenance Expenses 100 105 110 116 122 128 134 141 148 155 163 171 Advertising Expenses 2,200 2,200 2,200 2,200 2,200 2,200 4,950 5,500 6,266 5,199 9,620 10,420 Total Operating Expens $ 12,525 $ 13,041 $ 13,583 $ 14,152 $ 14,750 $ 15,378 $ 18,786 $ 20,028 $ 21,521 $ 21,216 $ 26,438 $ 31,618 Income From Operatio: $ 12,475 $ 13,209 $ 13,979 $ 14,788 $ 15,637 $ 16,530 $ 14,716 $ 15,149 $ 15,416 $ 4,334 $ (755) $ 3,999 $ Interest Income (Expense) (100) (105) (110) (116) (122) (128) (134) (141) (148) (155) (163) (171) Income Before Income $ 12,375 $ 13,104 $ 13,868 $ 14,673 $ 15,516 $ 16,402 $ 14,582 $ 15,008 $ 15,268 $ 4,179 $ (917) $ 3,828 $ Income Tax Expense 750 788 827 868 912 957 1,005 1,055 1,108 1,164 1,222 1,283 Net Income $ 11,625 $ 12,316 $ 13,042 $ 13,804 $ 14,604 $ 15,445 $ 13,577 $ 13,953 $ 14,160 $ 3,016 $ (2,139) $ 2,545 $ 122,917 7,959 7,561 23,876 3,979 1,592 55,155 223,038 139,478 (1,592) 137,886 11,938 125,948