Answered step by step
Verified Expert Solution
Question
1 Approved Answer
Determine the percent of a standard normal distribution N( = 0; o = 1) is found in each region. Be sure to draw a


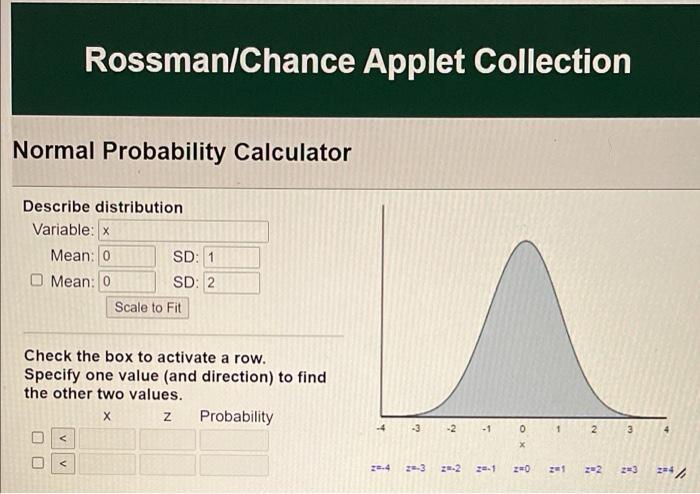
Determine the percent of a standard normal distribution N( = 0; o = 1) is found in each region. Be sure to draw a graph. Write your answer as a percent rounded to the nearest tenth. a) The region Z < 1.35 is approximately % of the area under the standard normal curve. b) The region Z> 1.48 is approximately c) The region -0.4 < Z < 1.5 is approximately % of the area under the standard normal curve. % of the area under the standard normal curve. Rossman/Chance Applet Collection Normal Probability Calculator Describe distribution Variable: x Mean: 0 O Mean: 0 SD: 1 SD: 2 Scale to Fit Check the box to activate a row. Specify one value (and direction) to find the other two values. X Z Probability 37 N 2 -3 Z=-2 A 28-1 z=0 E 2 2-2 3 2=4
Step by Step Solution
★★★★★
3.32 Rating (173 Votes )
There are 3 Steps involved in it
Step: 1
aFROM STANDARD NORMAL TABLE Cumulative Area Under The Standard Normal ...
Get Instant Access to Expert-Tailored Solutions
See step-by-step solutions with expert insights and AI powered tools for academic success
Step: 2

Step: 3

Ace Your Homework with AI
Get the answers you need in no time with our AI-driven, step-by-step assistance
Get Started


