Answered step by step
Verified Expert Solution
Link Copied!

Question

1 Approved Answer

For this assignment, use Excel to run descriptive statistics (and frequencies/pivot tables) using Emily's survey data Download Emily's survey data and complete an analysis of

For this assignment, use Excel to run descriptive statistics (and frequencies/pivot tables) using Emily's survey data Download Emily's survey data and complete an analysis of demographic data for those who attended training and those who did not. A short narrative will be included in your assignment submission.

You willgenerate descriptive statistics for the demographic variables and determine which questions may benefit from a frequency table.See instructions in the Excel file as well as the demo video.

The assignment data file includes a number of tabs:

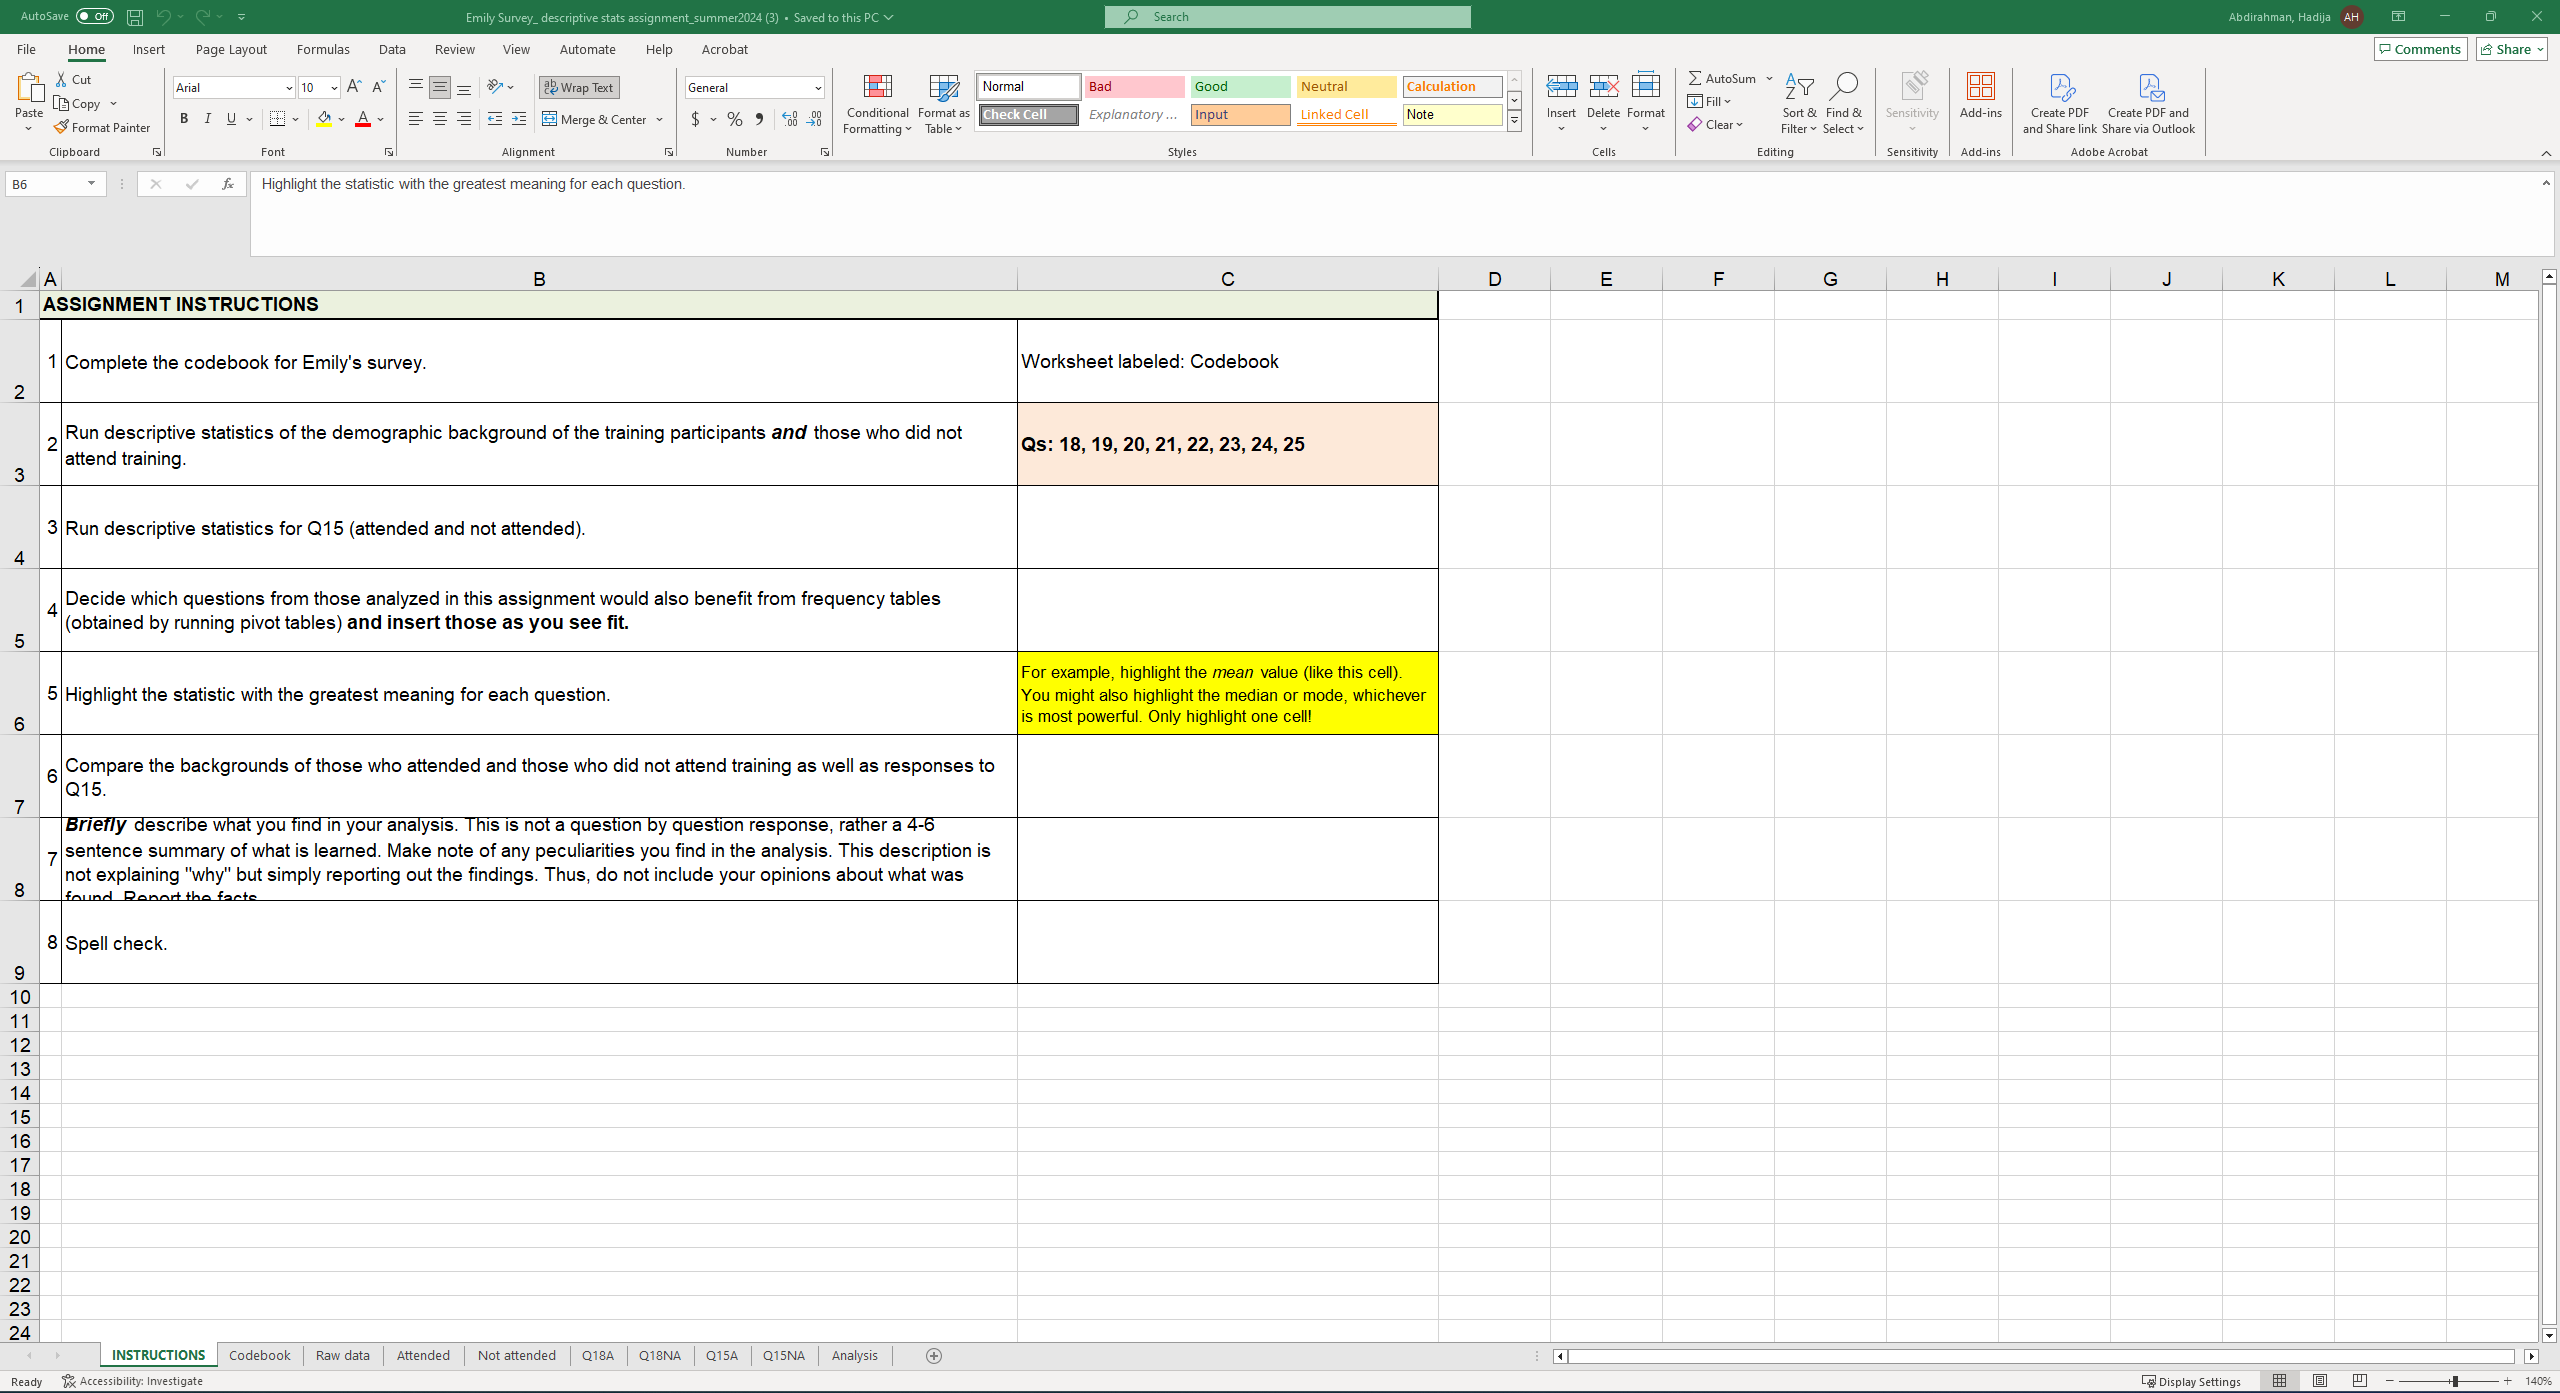
  • Instructions. Outlines the expectations for the assignment.
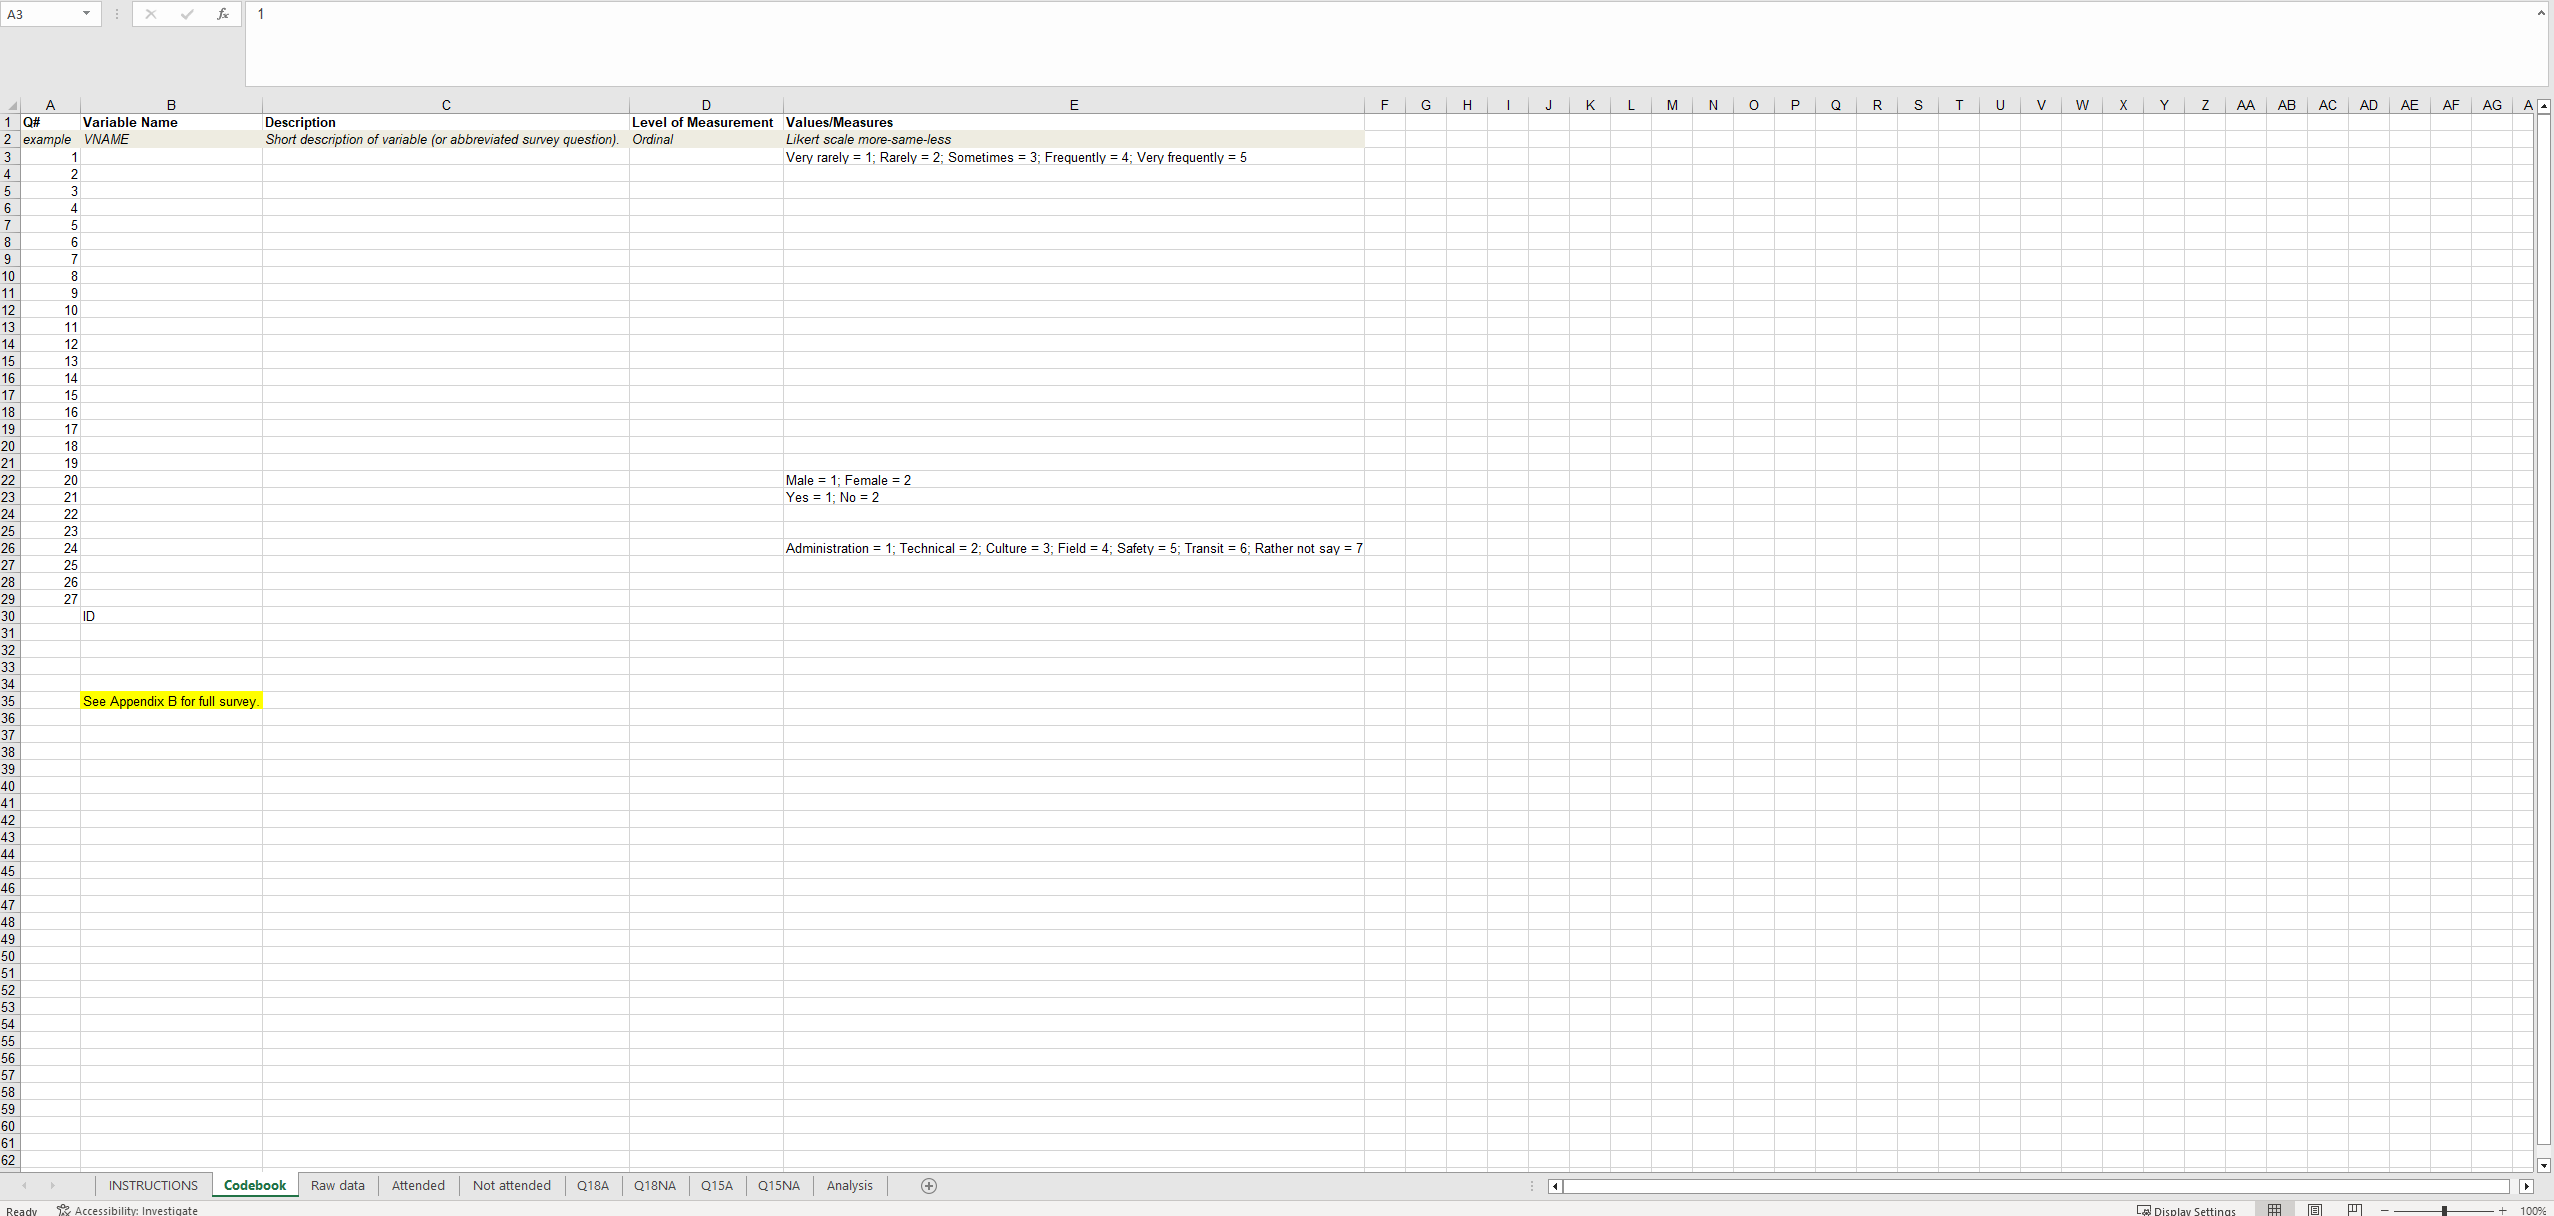
  • Codebook. You will complete the codebook following the examples provided earlier in the course. Review these examples so you appropriately label the variable name which is much shorter than the description.
  • Raw data. This is the raw data file of all responses to Emily's survey.
  • Attended. This worksheet includes data for only those who attended training.
  • Not attended. This worksheet includes data for those who DID NOT attend training.
  • Q18A. In this worksheet, you can run descriptive statistics for the variable AGE for those who attended training.
  • Q18NA. In this worksheet, you can run descriptive statistics for the variable AGE for those who DID NOT attend training.
  • Analysis. In the box provided, provide a brief analysis of what you notice when comparing demographics and responses to Q15 from those who attended and did not attend training.
  • Q15A. In this worksheet, you can follow along in my demo to run descriptive statistics and a frequency table for responses to Q15 from those who attended training.
  • Q15NA. In this worksheet, you can run descriptive statistics and a frequency table for responses to Q15 from those who DID NOT attend training
image text in transcribedimage text in transcribed
A3 A B C D E F G H I J K L M N O P Q R S T U V W X Y Z AA AB |AC |AD |AE AF AG A 0# Variable Name Description Level of Measurement Values/Measures 2 example VNAME Short description of variable (or abbreviated survey question). Ordinal Likert scale more-same-less Very rarely = 1; Rarely = 2; Sometimes = 3; Frequently = 4; Very frequently = 5 Male = 1; Female = 2 Yes = 1; No = 2 Administration = 1; Technical = 2; Culture = 3; Field = 4; Safety = 5; Transit = 6; Rather not say = 7 ID See Appendix B for full survey. INSTRUCTIONS Codebook Raw data Attended Not attended Q18A Q18NA Q15A Q15NA Analysismer2024 (3) . Saved to this PC v Search Abdirahman, Hadija AH X AutoSave . Off Emily Survey_ descriptive stats assig Comments | Share File Home Insert Page Layout Formulas Data Review View Automate Help Acrobat & Cut E AutoSum ~ App O Arial 10 ~ A" A" 29 Wrap Text jeneral Normal Bad Good Neutral Calculation [B) Copy Fill Insert Delete Format Sort & Find & Sensitivity Add-ins Create PDF Create PDF and Paste BIULA EEE EE Merge & Center $ ~ % 9 08 -20 Conditional Format as Check Cell Explanatory ... Input Linked Cell Note Format Painter Formatting Table v Clear Filter ~ Select v and Share link Share via Outlook calls Clipboard Font Alignment Number Styles Editing Sensitivity Add-ins Adobe Acrobat B6 1 x v fx Highlight the statistic with the greatest meaning for each question. C D E F G H K L M A B 1 ASSIGNMENT INSTRUCTIONS 1 Complete the codebook for Emily's survey. Worksheet labeled: Codebook 2 2" Run descriptive statistics of the demographic background of the training participants and those who did not Qs: 18, 19, 20, 21, 22, 23, 24, 25 attend training. 3 3 Run descriptive statistics for Q15 (attended and not attended). Decide which questions from those analyzed in this assignment would also benefit from frequency tables (obtained by running pivot tables) and insert those as you see fit. 5 For example, highlight the mean value (like this cell). 5 Highlight the statistic with the greatest meaning for each question. You might also highlight the median or mode, whichever is most powerful. Only highlight one cell! 6 Compare the backgrounds of those who attended and those who did not attend training as well as responses to Q15. Briefly describe what you find in your analysis. This is not a question by question response, rather a 4-6 sentence summary of what is learned. Make note of any peculiarities you find in the analysis. This description is not explaining "why" but simply reporting out the findings. Thus, do not include your opinions about what was found Ronart the facts 8 Spell check. 20 24 INSTRUCTIONS Codebook Raw data Attended Not attended Q18A Q18NA Q15A Q15NA Analysis |+ Display Settings Ready 1% Accessibility: Investigate

Step by Step Solution

There are 3 Steps involved in it

Step: 1

blur-text-image

Get Instant Access to Expert-Tailored Solutions

See step-by-step solutions with expert insights and AI powered tools for academic success

Step: 2

blur-text-image

Step: 3

blur-text-image

Ace Your Homework with AI

Get the answers you need in no time with our AI-driven, step-by-step assistance

Get Started

Recommended Textbook for

Discrete and Combinatorial Mathematics An Applied Introduction

Authors: Ralph P. Grimaldi

5th edition

201726343, 978-0201726343

More Books

Students also viewed these Mathematics questions