Question
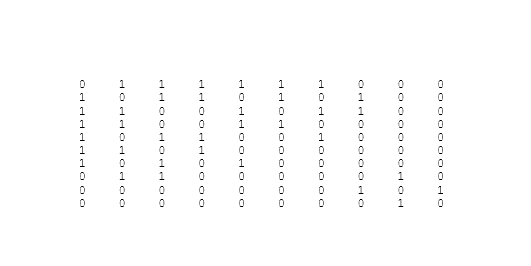
For this assignment you will use R to examine different characteristics of a small network The instructions/step are prefixed with the # symbol. The dataset,
For this assignment you will use R to examine different characteristics of a small network
The instructions/step are prefixed with the "#" symbol. The dataset, small-soc-net.txt
is under the "Files" tab under the "R" sub-directory. Save this file to a directory on your machine and make sure to update your path to import the file into R. Directions are below.
#The first is to install the sna network library into R.
#In R install the sna package by going through the following steps:
Select Packages From drop down menu select "Install Package" Choose USA (PA1) as the location Select sna
#Details on using the commnad in sna can be found in the sna manual: https://cran.r-project.org/web/packages/sna/sna.pdf
#To use the sna library after you've installed the package
#In R type: library(sna)
#Download the small-soc-net.txt dataset to a directory on your machine.
#To import the dataset into R and save it to a variable d, type:
d = read.table("C:\\Users\\CSMSU/Desktop\\Classes\\Spring 2017\\Network Science\\Assignments\\small-soc-net.txt", sep="\t")
#Make sure to change the path to where you saved the file on your machine. Also note the "\\" separators in the path between directories.
#convert the data you imported to a matrix:
mat
#type mat to see the matrix
mat
#centrality measures #determine the following centrality scores and for each centrality measure answer the following #questions:
rbind(colnames(mat),degree(mat, gmode="graph"))
rbind(colnames(mat),closeness(mat,gmode="graph"))
rbind(colnames(mat),betweenness(mat,gmode="graph"))
#Degree Centrality #----------------- #1. Which node has the greatest centrality score? #2. Which node has the least centrality score? #3. How can we intrepret these two results?
#Closeness Centrality #-------------------- #1. Which node has the greatest centrality score? #2. Which node has the least centrality score? #3. How can we interpret these two results?
#Betweenness Centrality #---------------------- #1. Which node has the greatest centrality score? #2. Which node has the least centrality score? #3. How can we intrepret these two results?
#count the number of cycles in the graph for each node
kcycle.census(mat,mode="graph")
#1. How many cycles are there of length 2? #2. What is the total number of cycles of length 3? #3. Which node has the greatest number of cycles? # a. How might this be interpreted?
#compute the number of paths between each node in the graph
#Which node has the most number of paths of length 1, 2, and 3? #Which node, if removed, would be most disruptive to the rest of the nodes in the network? #How do you rationalize your answer based on the results you obtained for betweenness centrality?
#compute the shortest paths between all nodes in the graph geodist(mat)
#In some cases nodes may have more than one shortest path to another node. Which nodes have the greatest number of shortest paths to another node
#to view the graph of the network type:
gplot(mat,gmode="graph", displaylabels=TRUE)
#change the names for the columns and rows
colnmames
#type mat to see the matrix with the new row and column names mat
#plot the data with the new row and column names displayed on the graph
#to see the labels type: gplot(mat, gmode="graph",displaylabels=TRUE)
#1. What is the name of the node with the greatest degree centrality score?

Step by Step Solution
There are 3 Steps involved in it
Step: 1

Get Instant Access to Expert-Tailored Solutions
See step-by-step solutions with expert insights and AI powered tools for academic success
Step: 2

Step: 3

Ace Your Homework with AI
Get the answers you need in no time with our AI-driven, step-by-step assistance
Get Started


