

Question
For this component of the project, you are asked to complete an analysis of financial ratios for Lowe's, both through time and relative to financial
 For this component of the project, you are asked to complete an analysis of financial ratios for Lowe's, both through time and relative to financial ratios for Home Depot, using both tables and graphs.
To complete the through-time analysis, obtain the financial data for Lowe's for the year 2011 and the prior two years of data. Calculate the financial ratios for each year and present these ratios in a table format. Select key ratios to emphasize by presenting them in a graphical/chart format. Discuss each ratio with respect to how it has adjusted across time and explain what conclusions you generate from each.
To complete the relative analysis, obtain the financial data for Lowe's for the year 2011 and selected data for competing firm(s) for 2011, in this case Home Depot. Calculate the financial ratios for each company and present these ratios in a table format. Select key ratios to emphasize by presenting them in a graphical/chart format. Discuss each ratio with respect to how the Lowe's ratio differs from the competing firm and what conclusions you generate from each. Note: If you compare your company's data with more than one competing firm, present each firm's ratios plus an average ratio of the competing firm collectively. Even if you have more than one competing firm in your analysis, you likely will want to compare Lowe's directly to its single closest competitor. The Financial Ratios Analysis Example, located in the Resources, using Home Depot data provides guidance on how to proceed. A summary of the basic data needed for this project has been provided.
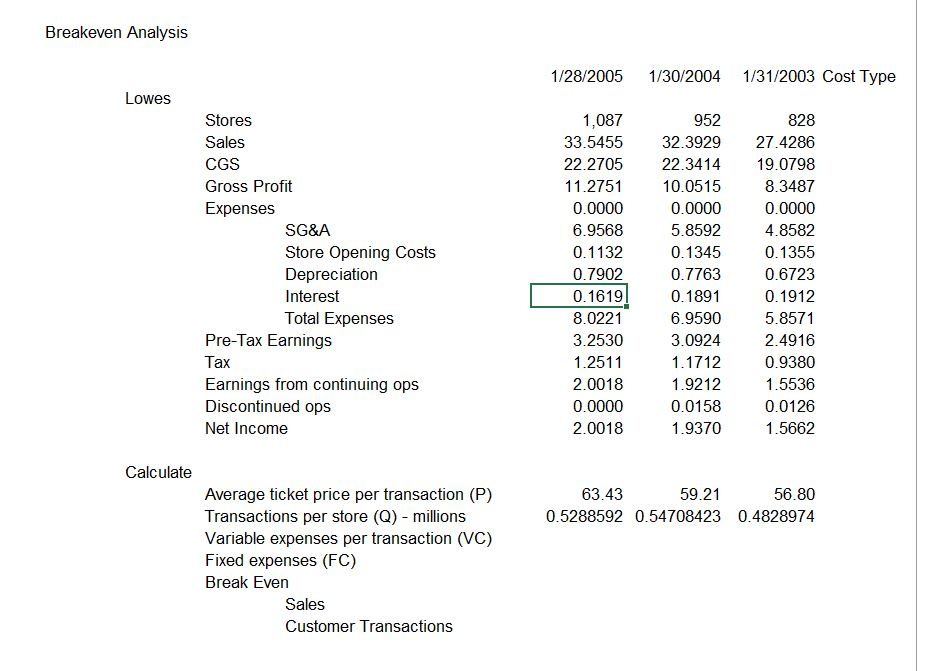
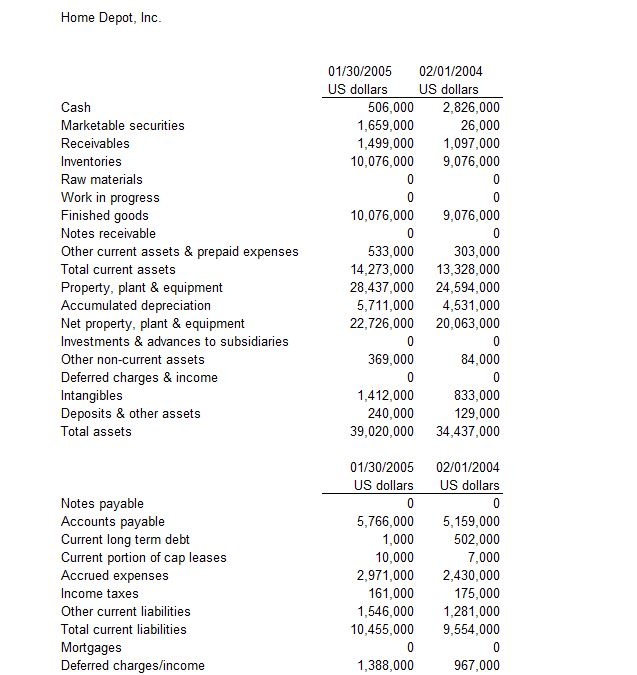
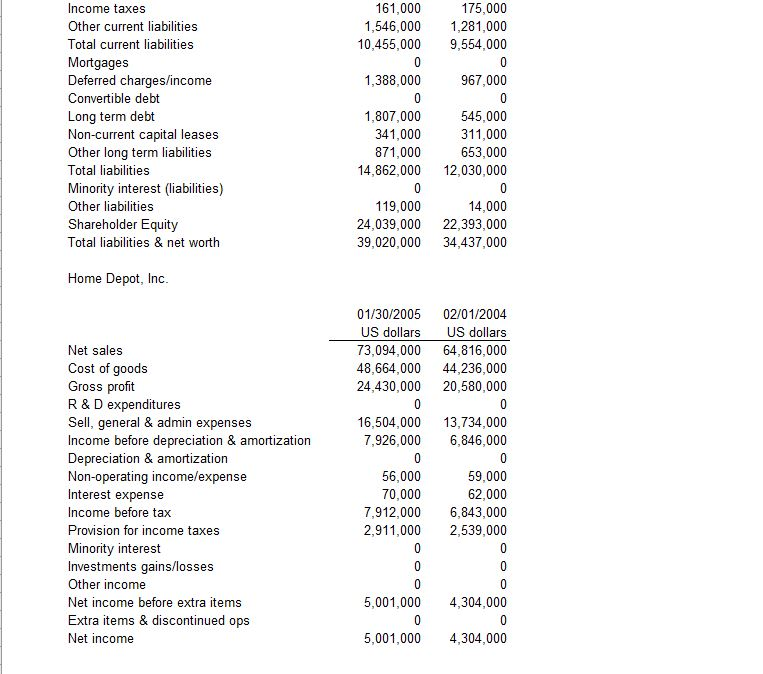
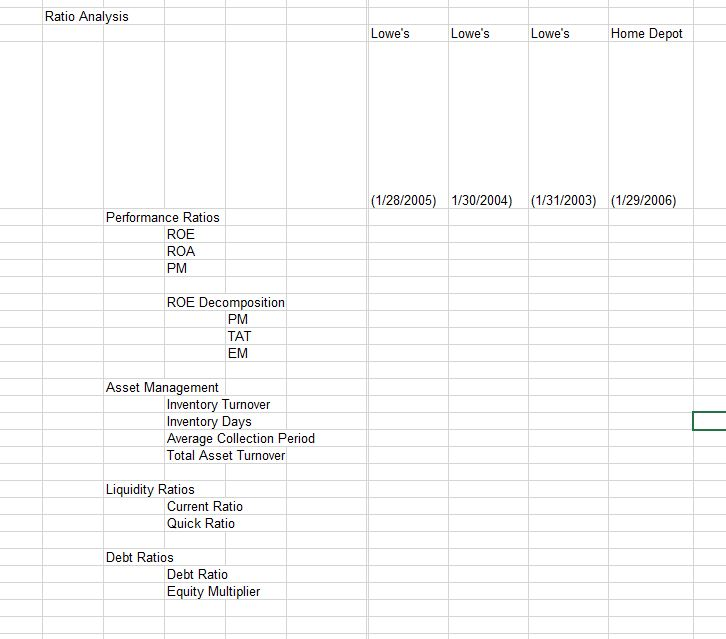
Breakeven Analysis 1/28/2005 1/30/2004 1/31/2003 Cost Type Lowes Stores Sales CGS Gross Profit Expenses 1,087 952 828 33.5455 32.3929 27.4286 22.2705 22.3414 19.0798 10.0515 0.0000 5.8592 0.1345 0.7763 0.1891 6.9590 3.0924 1.1712 1.9212 0.0158 1.9370 11.2751 0.0000 6.9568 0.1132 0.7902 0.1619 8.0221 3.2530 1.2511 2.0018 0.0000 2.0018 8.3487 0.0000 4.8582 0.1355 0.6723 0.1912 5.8571 2.4916 0.9380 1.5536 0.0126 1.5662 SG&A Store Opening Costs Depreciation Interest Total Expenses Pre-Tax Earnings ax Earnings from continuing ops Discontinued ops Net Income Calculate 63.43 Average ticket price per transaction (P) Transactions per store (Q) millions Variable expenses per transaction (VC) Fixed expenses (FC) Break Even 56.80 0.5288592 0.54708423 0.4828974 59.21 Sales Customer Transactions Home Depot, Inc 01/30/2005 02/01/2004 US dollars US dollars Cash Marketable securities Receivables Inventories Raw materials Work in progress Finished goods Notes receivable Other current assets & prepaid expenses Total current assets Property, plant & equipment Accumulated depreciation Net property, plant & equipment Investments & advances to subsidiaries Other non-current assets Deferred charges & income Intangibles Deposits & other assets Total assets 506,000 2,826,000 26,000 1,499,000 1,097,000 10,076,000 9,076,000 1,659,000 10,076,000 9.076,000 303,000 14,273,000 13,328,000 28,437,000 24,594,000 5,711,000 4,531,000 22,726,000 20,063,000 533,000 369,000 84,000 833,000 129,000 39,020,000 34,437,000 1,412,000 240,000 01/30/2005 02/01/2004 US dollars US dollars Notes payable Accounts payable Current long term debt Current portion of cap leases Accrued expenses Income taxes Other current liabilities Total current liabilities Mortgages Deferred charges/income 5,766,000 5,159,000 502,000 7,000 2,971,000 2,430,000 175,000 1,546,000 1,281,000 10,455,000 9,554,000 1,000 10,000 161,000 1,388,000 967,000 Ratio Analysis Lowe's Lowe's Lowe's Home Depot (1/28/2005) 1/30/2004) (1/31/2003) (1/29/2006) Performance Ratios ROE ROA PM ROE Decomposition PM TAT EM Asset Management Inventory Turnover Inventory Days Average Collection Period Total Asset Turnover Liquidity Ratios Current Ratio Quick Ratio Debt Ratios Debt Ratio Equity Multiplier Breakeven Analysis 1/28/2005 1/30/2004 1/31/2003 Cost Type Lowes Stores Sales CGS Gross Profit Expenses 1,087 952 828 33.5455 32.3929 27.4286 22.2705 22.3414 19.0798 10.0515 0.0000 5.8592 0.1345 0.7763 0.1891 6.9590 3.0924 1.1712 1.9212 0.0158 1.9370 11.2751 0.0000 6.9568 0.1132 0.7902 0.1619 8.0221 3.2530 1.2511 2.0018 0.0000 2.0018 8.3487 0.0000 4.8582 0.1355 0.6723 0.1912 5.8571 2.4916 0.9380 1.5536 0.0126 1.5662 SG&A Store Opening Costs Depreciation Interest Total Expenses Pre-Tax Earnings ax Earnings from continuing ops Discontinued ops Net Income Calculate 63.43 Average ticket price per transaction (P) Transactions per store (Q) millions Variable expenses per transaction (VC) Fixed expenses (FC) Break Even 56.80 0.5288592 0.54708423 0.4828974 59.21 Sales Customer Transactions Home Depot, Inc 01/30/2005 02/01/2004 US dollars US dollars Cash Marketable securities Receivables Inventories Raw materials Work in progress Finished goods Notes receivable Other current assets & prepaid expenses Total current assets Property, plant & equipment Accumulated depreciation Net property, plant & equipment Investments & advances to subsidiaries Other non-current assets Deferred charges & income Intangibles Deposits & other assets Total assets 506,000 2,826,000 26,000 1,499,000 1,097,000 10,076,000 9,076,000 1,659,000 10,076,000 9.076,000 303,000 14,273,000 13,328,000 28,437,000 24,594,000 5,711,000 4,531,000 22,726,000 20,063,000 533,000 369,000 84,000 833,000 129,000 39,020,000 34,437,000 1,412,000 240,000 01/30/2005 02/01/2004 US dollars US dollars Notes payable Accounts payable Current long term debt Current portion of cap leases Accrued expenses Income taxes Other current liabilities Total current liabilities Mortgages Deferred charges/income 5,766,000 5,159,000 502,000 7,000 2,971,000 2,430,000 175,000 1,546,000 1,281,000 10,455,000 9,554,000 1,000 10,000 161,000 1,388,000 967,000 Ratio Analysis Lowe's Lowe's Lowe's Home Depot (1/28/2005) 1/30/2004) (1/31/2003) (1/29/2006) Performance Ratios ROE ROA PM ROE Decomposition PM TAT EM Asset Management Inventory Turnover Inventory Days Average Collection Period Total Asset Turnover Liquidity Ratios Current Ratio Quick Ratio Debt Ratios Debt Ratio Equity MultiplierStep by Step Solution
There are 3 Steps involved in it
Step: 1

Get Instant Access to Expert-Tailored Solutions
See step-by-step solutions with expert insights and AI powered tools for academic success
Step: 2

Step: 3
Ace Your Homework with AI
Get the answers you need in no time with our AI-driven, step-by-step assistance
Get Started
Personal Finance
Authors: Richard Stanton
2nd Edition
1519662106, 978-1519662101