For this module, you will examine the case of the AES Corporation, an electrical power generator with plants worldwide. To obtain this case, please go to the Harvard Business School Publishing site and purchase the case Globalizing the Cost of Capital and Capital Budgeting at AES (25 pages). To work on the case, you will use the AES student template (XLS)
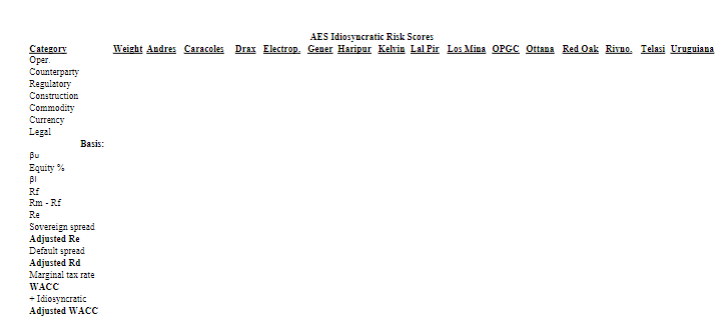
This case calls for using the methodology and data provided to calculate the Weighted Average Cost of Capital for 15 power plants that AES operates across the world. After this is calculated, you will calculate the value of the equity of AES's Lal Pir plant in Pakistan.
One of the key takeaways from this exercise is the role that government policy, stability, and predictability play in foreign direct investment (FDI). In countries where government policies are unstable or unreliable, expected returns from FDI rise to levels that make some projects unviable or eye-wateringly expensive.
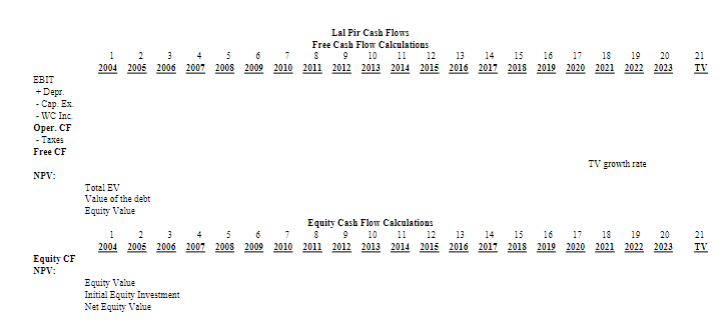
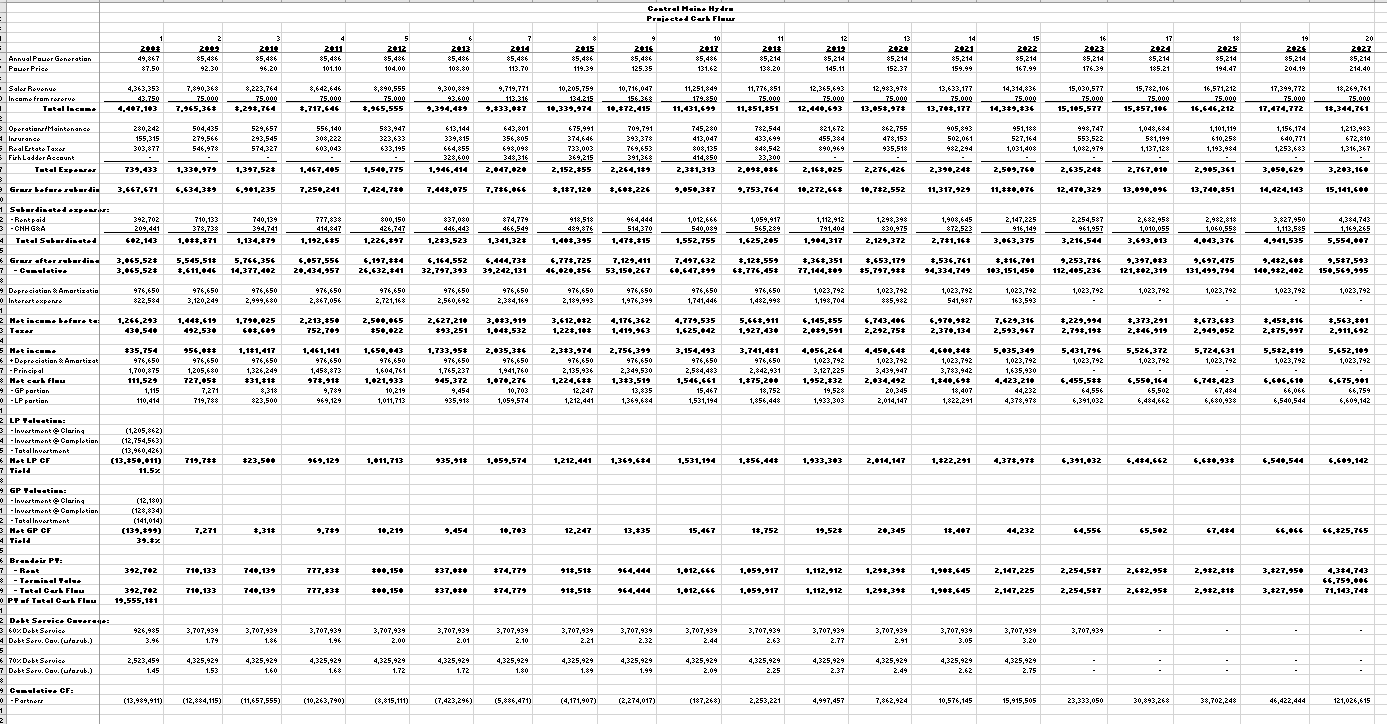
Separately, since we are talking about power generation, you added a detailed analysis of a hydroelectric plant in central Maine that you might find interesting. This plant does not have an international dimension, but it does have one feature that is common to many investments nowadays - the concept of partnerships.
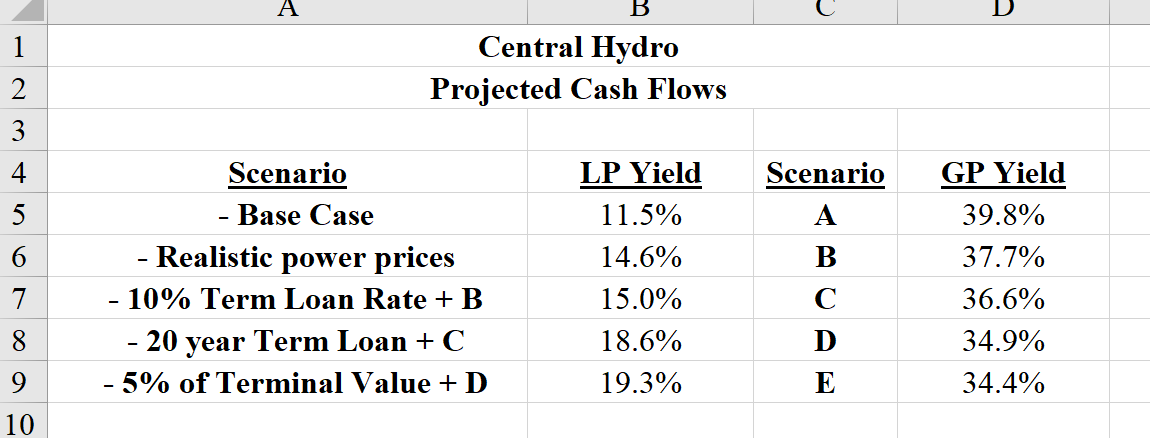
Investments can be made as partnerships so that limited partners (LPs) own different parts of the assets. For example, an LP with a high tax rate can own the assets themselves, so they can take advantage of the tax shield provided by the depreciation expense. Other LPs can take portions of the cash flows as income without explicitly owning the asset. With a partnership, the benefits are allocated based on the particular needs of the partner investors and the degree of risk they are taking. So, if an LP gets the first stream of cash flows, the yields that will be associated with that cash flow stream will be lower as their risk is lower. LPs taking later streams (in the example here, subordinated payments) receive higher yields to account for the higher risk they are incurring.
The largest risk goes to the general partner (GP) as they take a very small cut (1%) of the cash flows and must wait, in this case 20 years, to get a boost in their cash flow allocation (in our case 50%). This is because the GP doesn't want to put all its assets in the project as it wants to develop other projects with the GP's assets. The LPs do want the GP involved because it is the GP that is responsible for operating the project and generating the projected cash flows. With the bulk of the return to the GP coming after year 20, the LPs just know that the project will be well run as the GP wants to cash flows starting in year 21 not to be prejudiced by poor plant management.
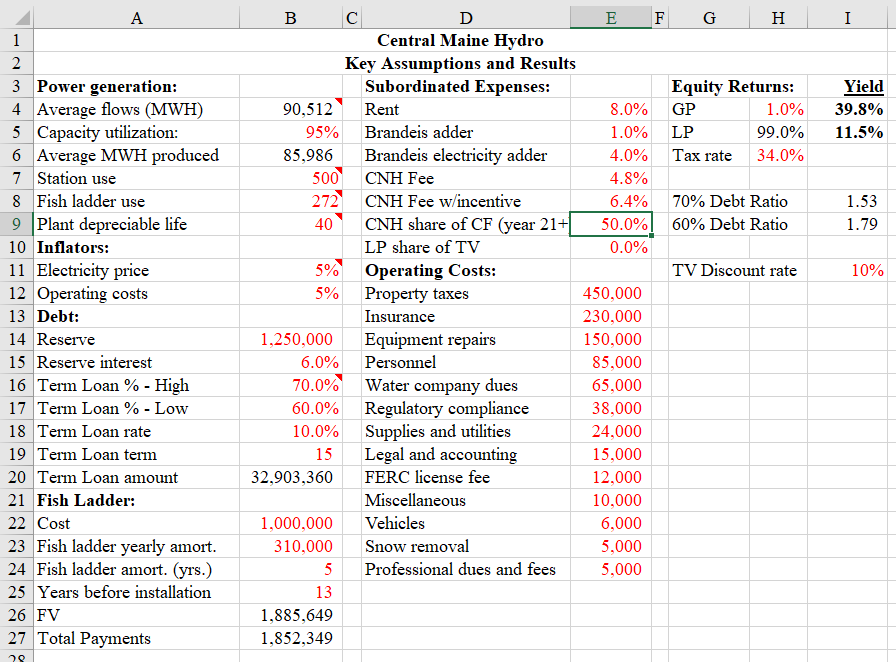
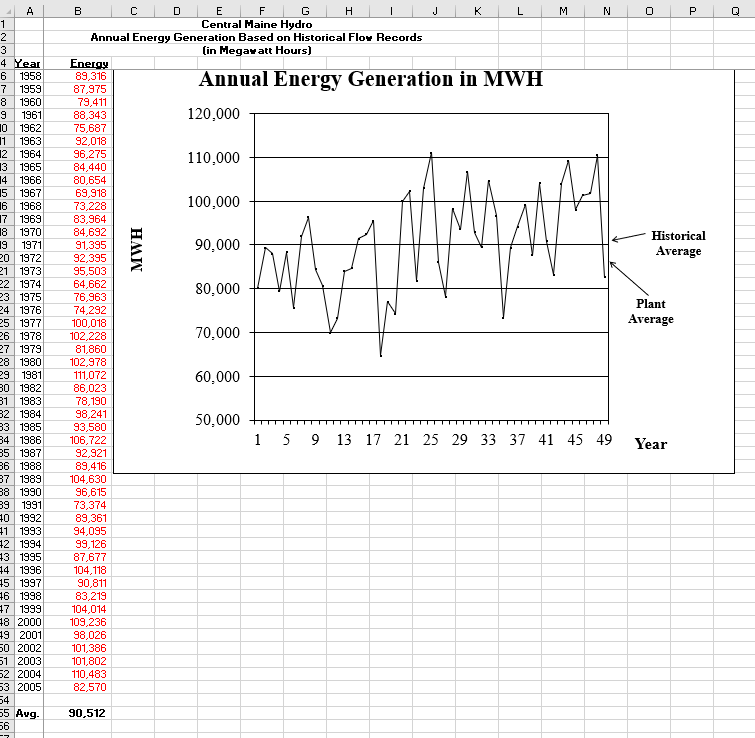
In doing the partnership, the benefits are allocated to those that benefit the most and in doing so, the allocation of the assets is optimized. The cash flows associated with the project are:
AES Idiosyncratic Risk Scores Weight Andres Caracoles Drat Electrop. Gener Haripur Kehir Lal Fir Los Miss OPGC Ottaes Red Oak Rivdo. Telasi Uruguiana Category Oper. Counterparty Regulatory Construction Commodity Currency Legal Basis: Bu Equity BI RE Rm - Ri Re Sovereign spread Adjusted Re Default spread Adjusted Rd Marginal tax rate WACC -Idiosyncratic Adjusted WACC Lal Pir Cash Flows Free Cash Flow Calculations 2 5 6 8 9 10 11 12 14 15 16 17 18 19 20 2004 2005 2006 2007 2008 2009 2010 2011 2012 2013 2014 2015 2016 2017 2018 2019 2020 2021 2022 2023 1 3 4 7 13 21 TV EBIT +Depr - Cap. Ex - WC Inc Oper. CF - Taxes Free CF NPV: TV growth rate Total EV Value of the debt Equity Value Equity Cash Flow Calculations 1 2 3 8 9 10 11 12 13 14 15 16 17 18 19 20 2004 2005 2006 2007 2008 2009 2010 2011 2012 2013 2014 2015 2016 2017 2018 2019 2020 2021 2022 2023 4 21 TV Equity CF NPV: Equity Value Initial Equity Investment Net Equity Value I Yield 39.8% 11.5% 1.53 1.79 10% A 1 2 3 Power generation: 4 Average flows (MWH) 5 Capacity utilization: 6 Average MWH produced 7 Station use 8 Fish ladder use 9 Plant depreciable life 10 Inflators: 11 Electricity price 12 Operating costs 13 Debt: 14 Reserve 15 Reserve interest 16 Term Loan % - High 17 Term Loan % - Low 18 Term Loan rate 19 Term Loan term 20 Term Loan amount 21 Fish Ladder: 22 Cost 23 Fish ladder yearly amort. 24 Fish ladder amort. (yrs.) 25 Years before installation 26 FV 27 Total Payments B D E F G H Central Maine Hydro Key Assumptions and Results Subordinated Expenses: Equity Returns: 90,512 Rent 8.0% GP 1.0% 95% Brandeis adder 1.0% LP 99.0% 85,986 Brandeis electricity adder 4.0% Tax rate 34.0% 500 CNH Fee 4.8% 272 CNH Fee w/incentive 6.4% 70% Debt Ratio 40 CNH share of CF (year 21+ 50.0% 60% Debt Ratio LP share of TV 0.0% 5% Operating Costs: TV Discount rate 5% Property taxes 450,000 Insurance 230,000 1,250,000 Equipment repairs 150,000 6.0% Personnel 85,000 70.0% Water company dues 65,000 60.0% Regulatory compliance 38,000 10.0% Supplies and utilities 24,000 15 Legal and accounting 15,000 32,903,360 FERC license fee 12,000 Miscellaneous 10,000 1,000,000 Vehicles 6,000 310,000 Snow removal 5,000 5 Professional dues and fees 5.000 13 1,885,649 1,852,349 28 Central Huis. Hydr Project Cul Flour - = 1 1 2011 49,867 87.50 Annual Pouer Generation - Pauer Price 2 2012 85,486 92.30 3 2010 85,486 46.20 4 2011 85,486 101.10 5 2012 85,486 104.00 6 2013 85,486 108.80 7 2012 85,486 113.70 8 2015 85,486 119.39 21 85,486 125.35 10 2017 85,486 131.62 11 2011 85,214 138.20 % 12 2012 85,214 145.11 13 2020 85,214 152.37 14 2021 85,214 159.99 15 2022 85,214 167.99 16 2023 85,214 176.39 17 2022 85,214 185.21 18 2125 85,214 194.47 19 2026 85,214 204.19 20 2027 85,214 214.40 Salor Revenue Income from reserve Tatal lcn. 4,363,353 43.750 4.4.7.103 7,890,368 75.000 7.945.345 8,223,764 75.000 *.29.764 8,642,646 75.000 6.717.446 8,890,555 75.000 6.965.555 9,300,884 43.600 9,394,419 9,719,771 113.316 9.033..7 10,205,759 134.215 10.339.974 10,716,047 _156.36 , 10.72.415 11,251,849 179.850 11.131.699 11,776,451 75.000 11.051.051 12,365,693 75.000 12.44.,693 12,983,978 75.000 13,5,97 13,633,177 75.000 13,7,177 14,314,836 75.000 14.39.36 15,030,577 75.000 15,195,577 15,782,106 75.000 15.57.100 16,571,212 75.000 16.646,212 17,399,772 75.000 17.474.772 18,269,761 75.000 14.344.741 Operation/Maintenance Inurance 5 Real Estate Taxer FirhLadder Account 7 2 Total Expen 280,242 155,315 303,877 504,435 274,566 546,978 529,657 293,545 574,327 556,140 308,222 603,043 583,947 323,633 633,195 613,144 339,815 664,855 328,600 1,946,414 643,801 356,805 698,098 343 316 2.47..20 675,991 374,646 733,003 369 215 2.152.55 709,791 393,378 769.653 391,368 2,244,109 745,280 413,047 808,135 414,850 2,301,313 782,544 433,699 $48,542 33,300 2.2.226 821,672 455,384 890,969 862,755 478,15) 935,518 905,893 502,061 982,294 451,188 527,164 1,031,408 998,747 553,522 1,082,979 1,048,684 581,199 1,137,120 1,101,119 610,258 1,193,984 1,156,174 640,771 1,253,683 1,212,983 672,810 1,316,267 739.433 1,330,97 1.397.52# 1,467,405 1,54.775 2,16..25 2,274,426 2.39..24 2.5.9.76 2.435,243 2.767..10 2.9.5.361 3..5..629 3.2.3.16 e Gror before retardi. 3.667.671 4.434,309 4.901,235 7.256,241 7.424.7* 7.441..75 7.7*4..66 1.117,120 *.*.*.226 ..5..37 9.753.76 1..272.600 10.7+2,552 11,317,929 11.**..76 12.470,329 13.....96 13,746,51 14.424.143 15.141.6.0 Subordinateur 2 - Rentrald 3 - CNH G&A 4 Total Subordinated 5 Grus after rekordine 7 - Caselatie. 392,702 209,441 2,143 710,133 378,738 1.**.*71 740,139 394,741 1,134,079 777,838 414,847 1,192.4+5 800,150 426,747 1,226,97 837,080 446,443 1,2+3,523 874,779 466,549 1,341,325 918,518 489,876 1,403,395 964,444 514,370 1.478.15 1,012,644 540,089 1,552.755 1,059,917 565,289 1.425.2.5 1,112,912 791,404 1,964,317 1,298,398 830.975 2,129,372 1,908,645 872.523 2.7+1,160 2,147,225 916 149 3,043,375 2,254,58T 961,957 3.214,544 2,682,958 1,010,055 3.493..13 2,982,818 1,060,558 4.43,376 3,827,450 1,113,585 4.941.535 4.384.743 1 169,265 5.554...7 3.45,521 3..45.520 5,545,516 3,611,046 5.766,356 14,377,402 4.57.556 20.434.757 6,164,552 32,797,393 4.444.73# 39,242,101 4,776,725 44..20.056 7,129,411 53,15.,267 7.497.632 ,447,99 3,120,55 40.776,450 3,34,351 77,144.4.4 6,453,179 35,797,000 8,534,761 14,334,74 *.*14,701 103,151,45 24.632.141 9.253.76 112,405,236 9.397..+3 121.**2,319 9.497.475 131,499,794 7,4+2,+ 146,9+2.4.2 9,5+7,593 156,569,995 1,023,742 1,023,792 976,650 822,584 1,023,792 976,650 3,120,249 976,650 2,999,680 976,650 2,867,056 976,650 2,721,168 976,650 2,560,692 976,650 2,384,169 976,650 2,189,993 976,650 1,976,399 976,650 1,482,998 976,650 1,741,446 1,025,792 1,198,704 1,023,792 1,023,792 885,982 1,023,792 541,987 1,023,792 163,593 1,023,792 Depreciation & Amortizatia Interer expono 1 2 Matince before te 3 Taxa 3 1,264,293 1.79...25 2.213,5 752.709 2,5....65 +5...22 2.627.210 #93.251 3,03,919 1..4#.532 3,612,02 1,223,100 4.174.362 1.419.963 4.779,535 1.425.42 5.663.911 1,927.410 4,145,055 2,039,591 4,743,466 2.292.750 6,970,9+2 2,370,134 7.429.316 2,593,47 .229.994 2,741.19 .373.291 2,346.917 .473.43 2.949..52 3.45.*16 2,75,997 *.563.3.1 2.911,492 492.53. 5,431.796 1,023,792 5.524,372 1,023,792 5,724.631 1,023,792 5.5+2.019 1,023,792 5.652.109 1,022,792 +35,754 976,650 1,700,875 111.529 1,115 110,414 954,+++ 976,650 1,205,680 727..50 7,271 719,788 1,181,417 976,650 1,326,249 #31.010 8,318 823,500 1,461,141 976,650 1,458,872 97,918 4,789 969,129 1,45...43 476,650 1,604,761 1..21,90) 10,219 1,011,712 1,733,950 976,650 1,765,237 945,372 4,454 935,918 2,35,36 976,650 1,941,760 1..7.,276 10,703 1,059,574 2,313,974 976,650 2,135,926 1.224.4++ 12,247 1,212,441 2,754,399 976,650 2,349,530 1,3+3,519 13,625 1,369,684 3,154.49) 976,650 2,584,483 1.546.661 15,467 1,531,194 3.741.441 476,650 2,842,931 1,075,2.. 18,752 1,856,44 4.054.264 1,023,792 3,127,225 1,952.32 19,526 1,933,30) 1,023,792 3,439,947 2..34.492 20,345 2,014,147 1,023,792 3,783,942 1.4..69+ 18,407 1,822,291 5,035,349 1,023,792 1,635,930 4,423,210 44,232 4,378,978 4.4.4.410 4.455.5 64,556 6,391,032 4,556,164 65,502 6,484,662 4,743,423 67,484 6,680,938 4.475,901 66,754 6,609,142 6,540,544 s Mariscos + Depreciation & Amortizat 7 - Principal 3 Metcalflau 9 - GP partir - - LP portion 1 2 LP Tasties: 3 - Invartment Claring - Invartment Completion 5 - Total Investment Mut LP CF 7 Tield (1,205,862) (12,754,563) (13,960,426) (13.5...11) 11.5% 719,700 #23.5.. 169,129 1.11.713 935,918 1..59.574 1,212,441 1,349.644 1,531,194 .:56.44 1,933,303 2.14.147 1.+22.291 4,373,97 4,391,32 4.4+4.662 6,546,544 4.6.9.142 9 GP Yalzation: - Invartment Claring 1 - Invartment Completion 2 - Total Invertment 3 Met GP CF 4 Tiel (12,180) (128,834) (141,014) (139.09) 39.7 7.271 3,313 9.789 10.219 10,703 12.247 13.35 15.467 14.752 19.52# 2..345 14.4.7 44.232 44.554 45.5.2 47,414 66.25.765 392.702 710,133 74.,139 777.#3# *...15 37..10 #74,779 $17.510 1.12.666 1,059,917 1,112,912 1,290.90 1,9,645 2.147.225 2.254.5+7 2.4+2.750 2,962.010 3.+27.95 4,3+4.74) 44.759...4 71,143,74+ 71.,133 74.,139 777.30 *...15 +37..10 #74.779 913,513 964,44% 1..12,666 1..59.917 1,112,912 1.297.39 1.9.3.645 2.147.225 2.254.567 2.4+2.050 2.9+2.310 392.702 19.555.1+1 Brender PT 7 - Rent - Terminal Tale - . 9 - Total Cul Flou PT of Total Cal Flau 1 Dukt Service Crver: 3 60x Debt Service 4 Debt Serv.Cav.(ulorub.) 3,27,95 . 3,707,939 - 926,985 3.96 3,707,934 1.79 3,707,939 1.86 3,707,934 1.96 3,707,939 2.00 3,707,939 2.01 3,707,939 2.10 3,707,939 2.21 3,707,939 2.32 3,707,934 2.44 3,707,939 2.63 3,707,939 2.77 3,707,939 2.91 3,707,939 3.05 3,707,939 3.20 Toz Debt Service 7 Debt Serv. Oav. (urarub.) 2,523,459 1.45 4,325,929 1.53 4,325,929 1.60 4,325,929 1.68 4,325,929 1.72 4,325,929 1.72 4,325,929 1.80 4,325,929 1.84 4,325,929 1.99 4,325,929 2.09 4,325,929 2.25 4,325,929 2.37 4,325,929 4,325,929 2.62 4,325,929 2.75 : : 2.49 (13,984,911) (12,884,115) (11,657,555) (10,263,790) (8,815,111) (7,423,296) (5,886,471) (4,171,907) (2,274,017) Concletiv. CF . - Partners 2 (187,268) ) 2,253,221 4,997,457 7,862,924 10,576,145 15,915,505 23,333,050 30,893,268 38,702,248 46,422,444 121,026,615 Central Maine Hydro Amortization of Term Loan 16 2023 17 2024 Beginning Bal. Payment Interest - Principal Ending Bal. 1 2008 32.903.360 2,523,459 822,584 1,700,875 31,202,485 2 2009 31,202,485 4,325,929 3.120.249 1,205,680 29,996.805 3 2010 29,996.805 4,325,929 2.999,680 1.326,249 28.670.556 4 2011 28.670.556 4,325,929 2,867,056 1,458.873 27.211,683 5 2012 27.211,683 4,325,929 2.721,168 1,604,761 25.606.922 6 6 2013 25,606,922 4,325,929 2.560,692 1,765,237 23.841,686 7 2014 23.841.686 4,325,929 2,384,169 1.941.760 21.899.925 8 2015 21.899,925 4,325,929 2.189.993 2,135,936 19,763,989 9 2016 19,763,989 4,325,929 1,976,399 2,349,530 17,414,458 10 2017 17,414,458 4,325,929 1,741,446 2,584,483 14,829,975 11 2018 14,829.975 4,325,929 1.482.998 2.842,931 11,987.044 12 2019 11,987,044 4,325,929 1.198,704 3,127,225 8.859,819 13 2020 8.859,819 4,325,929 885,982 3,439,947 5.419.872 14 2021 5,419,872 4,325,929 541.987 3,783.942 1,635,930 15 2022 1,635,930 4.325,929 163,593 1,635,930 11 Central Maine Hydro Amortization of Term Loan 17 2024 1 2 3 4 5 6 Beginning Bal. 7 Payment 8 - Interest - - Principal L0 Ending Bal. 1 2 1 2008 28,202.880 926,985 705,072 221,913 27.980.967 2 2009 27,980.967 3,707,939 2.798,097 909,842 27,071,125 3 2010 27,071,125 3,707,939 2,707,112 1.000.827 26,070,298 4 2011 26,070,298 3,707,939 2.607.030 1.100.909 24,969,389 5 2012 24,969,389 3,707,939 2.496,939 1,211,000 23,758,388 6 2013 23,758,388 3,707,939 2,375.839 1,332.100 22,426,288 7 2014 22,426,288 3,707,939 2,242,629 1,465,310 20,960.978 8 2015 20.960,978 3,707,939 2,096,098 1.611,841 19,349,136 9 9 2016 19,349,136 3,707,939 1,934,914 1,773,026 17,576,111 10 2017 17,576,111 3,707,939 1,757,611 1,950,328 15,625,783 11 2018 15.625,783 3,707,939 1,562,578 2.145.361 13,480,422 12 2019 13,480,422 3,707,939 1,348,042 2,359,897 11,120,525 13 2020 11.120.525 3.707,939 1,112,053 2,595.887 8.524.638 14 2021 8.524.638 3,707,939 852,464 2.855,475 5,669.163 15 2022 5,669.163 3,707,939 566,916 3,141,023 2,528,140 16 2023 2,528,140 3,707,939 252,814 2,528.140 A 1 Central Maine Hydro 2 Projected Partnership Capital Structure 3 Construction Period 4 Projected Maximum 5 Construction Loan 43.263 44.263 6 Equity - GP 0.010 7 Equity - LPs 0.950 8 Total Equity 0.960 0.960 9 Total Construction Period Capital 44.223 45.223 10 Construction Period interest plus working capital 2.782 3.251 11 Total Startup Cost 47.005 48.474 12 Operating Startup (assuming maximum expenditures) 13 Term Loan % 60% 70% 14 Term Loan 29.084 33.932 15 Equity 16 - GP 0.194 0.145 1% 17 - LP's 19.196 14.397 99% 18 Total Equity 19.390 14.542 19 20 Total Capital 48.474 48.474 21 Operating Startup (assuming projected expenditures) 22 Term Loan % 60% 70% 23 Term Loan 28.203 32.903 24 Equity: 25 - GP 0.188 0.141 1% 26 - LP's 18.614 13.960 99% 27 Total Equity 18.802 14.101 28 29 Total Capital 47.005 47.005 20 0 P Q Annual Energy Generation in MWH MWH Historical Average Plant Average A 1 2 3 4 Year 6 1958 7 1959 8 1960 9 1961 10 1962 11 1963 2 1964 13 1965 14 1966 15 1967 16 1968 17 1969 8 1970 19 1971 20 1972 21 1973 22 1974 23 1975 24 1976 25 1977 26 1978 27 1979 28 1980 29 1981 30 1982 31 1983 B2 1984 33 1985 84 1986 85 1987 36 1988 87 1989 88 1990 39 1991 40 1992 11 1993 12 1994 13 1995 44 1996 15 1997 16 1998 47 1999 48 2000 49 2001 50 2002 51 2003 52 2004 3 2005 54 55 Avg. 56 B C D E F G . I J K L M N Central Maine Hydro Annual Energy Generation Based on Historical Flor Records (in Megav att Hours) Energy 89,316 87,975 79,411 88,343 120,000 75,687 92,018 96,275 110,000 84,440 80,654 69,918 73,228 100,000 83,964 84,692 91,395 90,000 92,395 95,503 64,662 80,000 76,963 74,292 100,018 102,228 70,000 81,860 102,978 111,072 60,000 86,023 78,190 98,241 50,000 93,580 106,722 1 5 9 13 17 21 25 29 33 37 41 45 49 92,921 89,416 104,630 96,615 73,374 89,361 94,095 99,126 87,677 104, 118 90,811 83,219 104,014 109,236 98,026 101,386 101,802 110,483 82,570 Year 90,512 A B H I J K I 1 D E F G Central Maine Hydro Electricity Price per KWH 2 3 2005 2006 2007 2008 2009 2010 2011 2012 2013 2014 4 MP Forecast Avg. 5 Price 6 Contract Price 7 Pessimistic Case 7.00 7.80 7.58 8.40 8.16 6.80 9.00 8.75 8.00 9.50 9.23 8.41 9.90 9.62 8.83 10.40 10.11 9.27 10.70 10.40 9.73 11.20 10.88 10.22 11.70 11.37 10.73 8 9 E 1 2 A B D F G H 1 Central Maine Hydro 2 Construction Loan Draw Schedule 3 (in MS) 4 # Month Year Draw Cumulative 14 10 July 1,500 12.046 15 11 August 1,424 13.470 16 12 September 1,511 14,981 17 13 October 1.628 16.609 18 14 November 1,615 18,224 19 15 December 1.841 20.065 2016 January 2007 1,947 22.012 21 17 February 976 22,988 22 18 March 612 23,600 23 19 April 1,260 24.860 24 20 May 1,267 26,127 25 21 June 1,709 27.836 26 22 July 1,631 29,467 27 23 August 1,398 30.865 28 24 September 1,385 32,250 29 25 October 1,274 33,524 30 26 November 1.227 34.751 31 27 December 1,371 36,122 32 28 January 2008 1,393 37,515 33 29 February 857 38,372 34 30 March 907 39,279 35 31 April 927 40,206 36 32 May 4.057 44.263 37 38 Note: All draws occurring between the Closing and Oct. 2005 are assumed to occur during Oct. 2005. 39 F G H I J K L M N O P Q R DE D Central Maine Hydro 210,000 Annual Energy Generation in MWH 29.015.776 650.000 2,000,000 31,665,776 Soft Costs: Construction insurance Brandeis payments: Land and water rights Cost reimbursement Construction period rent 120,000 500,000 500,000 1,500,000 2,500,000 110,000 900,243 400,000 32,966,019 100,000 CNH payments: General and administrative Fee MWH 90,000 A B 1 2 3 Hard Costs: 4 Construction, base 5 Construction, headpond 6 Contingencies 7 Total 8 9 Pending additions 10 Owner contingencies 11 Total 12 13 14 Hard and Soft Costs 15 16 17 18 19 20 21 22 23 24 25 26 27 28 500,000 920,000 1.420,000 630,000 1,340,000 48,483,787 80,000 Plant Average 70,000 Legal & accounting costs Banking & financing costs Construction period: Interest @10.5% Contingency - 100 bps Contingency - 1 month's interest Hedge fees Delay insurance 60,000 6,370.459 621,000 387,309 414,000 125,000 50,000 1 5 9 13 17 21 25 29 33 37 41 45 49 Year Working capital Contingency Debt service reserve 250,000 250,000 1,000,000 Total Soft Costs 15,517,768 B Central Hydro Projected Cash Flows 1 2 3 4. 5 6 7 Scenario - Base Case - Realistic power prices - 10% Term Loan Rate + B - 20 year Term Loan + C - 5% of Terminal Value + D LP Yield 11.5% 14.6% 15.0% 18.6% 19.3% Scenario A B D E GP Yield 39.8% 37.7% 36.6% 34.9% 34.4% 8 9 10 AES Idiosyncratic Risk Scores Weight Andres Caracoles Drat Electrop. Gener Haripur Kehir Lal Fir Los Miss OPGC Ottaes Red Oak Rivdo. Telasi Uruguiana Category Oper. Counterparty Regulatory Construction Commodity Currency Legal Basis: Bu Equity BI RE Rm - Ri Re Sovereign spread Adjusted Re Default spread Adjusted Rd Marginal tax rate WACC -Idiosyncratic Adjusted WACC Lal Pir Cash Flows Free Cash Flow Calculations 2 5 6 8 9 10 11 12 14 15 16 17 18 19 20 2004 2005 2006 2007 2008 2009 2010 2011 2012 2013 2014 2015 2016 2017 2018 2019 2020 2021 2022 2023 1 3 4 7 13 21 TV EBIT +Depr - Cap. Ex - WC Inc Oper. CF - Taxes Free CF NPV: TV growth rate Total EV Value of the debt Equity Value Equity Cash Flow Calculations 1 2 3 8 9 10 11 12 13 14 15 16 17 18 19 20 2004 2005 2006 2007 2008 2009 2010 2011 2012 2013 2014 2015 2016 2017 2018 2019 2020 2021 2022 2023 4 21 TV Equity CF NPV: Equity Value Initial Equity Investment Net Equity Value I Yield 39.8% 11.5% 1.53 1.79 10% A 1 2 3 Power generation: 4 Average flows (MWH) 5 Capacity utilization: 6 Average MWH produced 7 Station use 8 Fish ladder use 9 Plant depreciable life 10 Inflators: 11 Electricity price 12 Operating costs 13 Debt: 14 Reserve 15 Reserve interest 16 Term Loan % - High 17 Term Loan % - Low 18 Term Loan rate 19 Term Loan term 20 Term Loan amount 21 Fish Ladder: 22 Cost 23 Fish ladder yearly amort. 24 Fish ladder amort. (yrs.) 25 Years before installation 26 FV 27 Total Payments B D E F G H Central Maine Hydro Key Assumptions and Results Subordinated Expenses: Equity Returns: 90,512 Rent 8.0% GP 1.0% 95% Brandeis adder 1.0% LP 99.0% 85,986 Brandeis electricity adder 4.0% Tax rate 34.0% 500 CNH Fee 4.8% 272 CNH Fee w/incentive 6.4% 70% Debt Ratio 40 CNH share of CF (year 21+ 50.0% 60% Debt Ratio LP share of TV 0.0% 5% Operating Costs: TV Discount rate 5% Property taxes 450,000 Insurance 230,000 1,250,000 Equipment repairs 150,000 6.0% Personnel 85,000 70.0% Water company dues 65,000 60.0% Regulatory compliance 38,000 10.0% Supplies and utilities 24,000 15 Legal and accounting 15,000 32,903,360 FERC license fee 12,000 Miscellaneous 10,000 1,000,000 Vehicles 6,000 310,000 Snow removal 5,000 5 Professional dues and fees 5.000 13 1,885,649 1,852,349 28 Central Huis. Hydr Project Cul Flour - = 1 1 2011 49,867 87.50 Annual Pouer Generation - Pauer Price 2 2012 85,486 92.30 3 2010 85,486 46.20 4 2011 85,486 101.10 5 2012 85,486 104.00 6 2013 85,486 108.80 7 2012 85,486 113.70 8 2015 85,486 119.39 21 85,486 125.35 10 2017 85,486 131.62 11 2011 85,214 138.20 % 12 2012 85,214 145.11 13 2020 85,214 152.37 14 2021 85,214 159.99 15 2022 85,214 167.99 16 2023 85,214 176.39 17 2022 85,214 185.21 18 2125 85,214 194.47 19 2026 85,214 204.19 20 2027 85,214 214.40 Salor Revenue Income from reserve Tatal lcn. 4,363,353 43.750 4.4.7.103 7,890,368 75.000 7.945.345 8,223,764 75.000 *.29.764 8,642,646 75.000 6.717.446 8,890,555 75.000 6.965.555 9,300,884 43.600 9,394,419 9,719,771 113.316 9.033..7 10,205,759 134.215 10.339.974 10,716,047 _156.36 , 10.72.415 11,251,849 179.850 11.131.699 11,776,451 75.000 11.051.051 12,365,693 75.000 12.44.,693 12,983,978 75.000 13,5,97 13,633,177 75.000 13,7,177 14,314,836 75.000 14.39.36 15,030,577 75.000 15,195,577 15,782,106 75.000 15.57.100 16,571,212 75.000 16.646,212 17,399,772 75.000 17.474.772 18,269,761 75.000 14.344.741 Operation/Maintenance Inurance 5 Real Estate Taxer FirhLadder Account 7 2 Total Expen 280,242 155,315 303,877 504,435 274,566 546,978 529,657 293,545 574,327 556,140 308,222 603,043 583,947 323,633 633,195 613,144 339,815 664,855 328,600 1,946,414 643,801 356,805 698,098 343 316 2.47..20 675,991 374,646 733,003 369 215 2.152.55 709,791 393,378 769.653 391,368 2,244,109 745,280 413,047 808,135 414,850 2,301,313 782,544 433,699 $48,542 33,300 2.2.226 821,672 455,384 890,969 862,755 478,15) 935,518 905,893 502,061 982,294 451,188 527,164 1,031,408 998,747 553,522 1,082,979 1,048,684 581,199 1,137,120 1,101,119 610,258 1,193,984 1,156,174 640,771 1,253,683 1,212,983 672,810 1,316,267 739.433 1,330,97 1.397.52# 1,467,405 1,54.775 2,16..25 2,274,426 2.39..24 2.5.9.76 2.435,243 2.767..10 2.9.5.361 3..5..629 3.2.3.16 e Gror before retardi. 3.667.671 4.434,309 4.901,235 7.256,241 7.424.7* 7.441..75 7.7*4..66 1.117,120 *.*.*.226 ..5..37 9.753.76 1..272.600 10.7+2,552 11,317,929 11.**..76 12.470,329 13.....96 13,746,51 14.424.143 15.141.6.0 Subordinateur 2 - Rentrald 3 - CNH G&A 4 Total Subordinated 5 Grus after rekordine 7 - Caselatie. 392,702 209,441 2,143 710,133 378,738 1.**.*71 740,139 394,741 1,134,079 777,838 414,847 1,192.4+5 800,150 426,747 1,226,97 837,080 446,443 1,2+3,523 874,779 466,549 1,341,325 918,518 489,876 1,403,395 964,444 514,370 1.478.15 1,012,644 540,089 1,552.755 1,059,917 565,289 1.425.2.5 1,112,912 791,404 1,964,317 1,298,398 830.975 2,129,372 1,908,645 872.523 2.7+1,160 2,147,225 916 149 3,043,375 2,254,58T 961,957 3.214,544 2,682,958 1,010,055 3.493..13 2,982,818 1,060,558 4.43,376 3,827,450 1,113,585 4.941.535 4.384.743 1 169,265 5.554...7 3.45,521 3..45.520 5,545,516 3,611,046 5.766,356 14,377,402 4.57.556 20.434.757 6,164,552 32,797,393 4.444.73# 39,242,101 4,776,725 44..20.056 7,129,411 53,15.,267 7.497.632 ,447,99 3,120,55 40.776,450 3,34,351 77,144.4.4 6,453,179 35,797,000 8,534,761 14,334,74 *.*14,701 103,151,45 24.632.141 9.253.76 112,405,236 9.397..+3 121.**2,319 9.497.475 131,499,794 7,4+2,+ 146,9+2.4.2 9,5+7,593 156,569,995 1,023,742 1,023,792 976,650 822,584 1,023,792 976,650 3,120,249 976,650 2,999,680 976,650 2,867,056 976,650 2,721,168 976,650 2,560,692 976,650 2,384,169 976,650 2,189,993 976,650 1,976,399 976,650 1,482,998 976,650 1,741,446 1,025,792 1,198,704 1,023,792 1,023,792 885,982 1,023,792 541,987 1,023,792 163,593 1,023,792 Depreciation & Amortizatia Interer expono 1 2 Matince before te 3 Taxa 3 1,264,293 1.79...25 2.213,5 752.709 2,5....65 +5...22 2.627.210 #93.251 3,03,919 1..4#.532 3,612,02 1,223,100 4.174.362 1.419.963 4.779,535 1.425.42 5.663.911 1,927.410 4,145,055 2,039,591 4,743,466 2.292.750 6,970,9+2 2,370,134 7.429.316 2,593,47 .229.994 2,741.19 .373.291 2,346.917 .473.43 2.949..52 3.45.*16 2,75,997 *.563.3.1 2.911,492 492.53. 5,431.796 1,023,792 5.524,372 1,023,792 5,724.631 1,023,792 5.5+2.019 1,023,792 5.652.109 1,022,792 +35,754 976,650 1,700,875 111.529 1,115 110,414 954,+++ 976,650 1,205,680 727..50 7,271 719,788 1,181,417 976,650 1,326,249 #31.010 8,318 823,500 1,461,141 976,650 1,458,872 97,918 4,789 969,129 1,45...43 476,650 1,604,761 1..21,90) 10,219 1,011,712 1,733,950 976,650 1,765,237 945,372 4,454 935,918 2,35,36 976,650 1,941,760 1..7.,276 10,703 1,059,574 2,313,974 976,650 2,135,926 1.224.4++ 12,247 1,212,441 2,754,399 976,650 2,349,530 1,3+3,519 13,625 1,369,684 3,154.49) 976,650 2,584,483 1.546.661 15,467 1,531,194 3.741.441 476,650 2,842,931 1,075,2.. 18,752 1,856,44 4.054.264 1,023,792 3,127,225 1,952.32 19,526 1,933,30) 1,023,792 3,439,947 2..34.492 20,345 2,014,147 1,023,792 3,783,942 1.4..69+ 18,407 1,822,291 5,035,349 1,023,792 1,635,930 4,423,210 44,232 4,378,978 4.4.4.410 4.455.5 64,556 6,391,032 4,556,164 65,502 6,484,662 4,743,423 67,484 6,680,938 4.475,901 66,754 6,609,142 6,540,544 s Mariscos + Depreciation & Amortizat 7 - Principal 3 Metcalflau 9 - GP partir - - LP portion 1 2 LP Tasties: 3 - Invartment Claring - Invartment Completion 5 - Total Investment Mut LP CF 7 Tield (1,205,862) (12,754,563) (13,960,426) (13.5...11) 11.5% 719,700 #23.5.. 169,129 1.11.713 935,918 1..59.574 1,212,441 1,349.644 1,531,194 .:56.44 1,933,303 2.14.147 1.+22.291 4,373,97 4,391,32 4.4+4.662 6,546,544 4.6.9.142 9 GP Yalzation: - Invartment Claring 1 - Invartment Completion 2 - Total Invertment 3 Met GP CF 4 Tiel (12,180) (128,834) (141,014) (139.09) 39.7 7.271 3,313 9.789 10.219 10,703 12.247 13.35 15.467 14.752 19.52# 2..345 14.4.7 44.232 44.554 45.5.2 47,414 66.25.765 392.702 710,133 74.,139 777.#3# *...15 37..10 #74,779 $17.510 1.12.666 1,059,917 1,112,912 1,290.90 1,9,645 2.147.225 2.254.5+7 2.4+2.750 2,962.010 3.+27.95 4,3+4.74) 44.759...4 71,143,74+ 71.,133 74.,139 777.30 *...15 +37..10 #74.779 913,513 964,44% 1..12,666 1..59.917 1,112,912 1.297.39 1.9.3.645 2.147.225 2.254.567 2.4+2.050 2.9+2.310 392.702 19.555.1+1 Brender PT 7 - Rent - Terminal Tale - . 9 - Total Cul Flou PT of Total Cal Flau 1 Dukt Service Crver: 3 60x Debt Service 4 Debt Serv.Cav.(ulorub.) 3,27,95 . 3,707,939 - 926,985 3.96 3,707,934 1.79 3,707,939 1.86 3,707,934 1.96 3,707,939 2.00 3,707,939 2.01 3,707,939 2.10 3,707,939 2.21 3,707,939 2.32 3,707,934 2.44 3,707,939 2.63 3,707,939 2.77 3,707,939 2.91 3,707,939 3.05 3,707,939 3.20 Toz Debt Service 7 Debt Serv. Oav. (urarub.) 2,523,459 1.45 4,325,929 1.53 4,325,929 1.60 4,325,929 1.68 4,325,929 1.72 4,325,929 1.72 4,325,929 1.80 4,325,929 1.84 4,325,929 1.99 4,325,929 2.09 4,325,929 2.25 4,325,929 2.37 4,325,929 4,325,929 2.62 4,325,929 2.75 : : 2.49 (13,984,911) (12,884,115) (11,657,555) (10,263,790) (8,815,111) (7,423,296) (5,886,471) (4,171,907) (2,274,017) Concletiv. CF . - Partners 2 (187,268) ) 2,253,221 4,997,457 7,862,924 10,576,145 15,915,505 23,333,050 30,893,268 38,702,248 46,422,444 121,026,615 Central Maine Hydro Amortization of Term Loan 16 2023 17 2024 Beginning Bal. Payment Interest - Principal Ending Bal. 1 2008 32.903.360 2,523,459 822,584 1,700,875 31,202,485 2 2009 31,202,485 4,325,929 3.120.249 1,205,680 29,996.805 3 2010 29,996.805 4,325,929 2.999,680 1.326,249 28.670.556 4 2011 28.670.556 4,325,929 2,867,056 1,458.873 27.211,683 5 2012 27.211,683 4,325,929 2.721,168 1,604,761 25.606.922 6 6 2013 25,606,922 4,325,929 2.560,692 1,765,237 23.841,686 7 2014 23.841.686 4,325,929 2,384,169 1.941.760 21.899.925 8 2015 21.899,925 4,325,929 2.189.993 2,135,936 19,763,989 9 2016 19,763,989 4,325,929 1,976,399 2,349,530 17,414,458 10 2017 17,414,458 4,325,929 1,741,446 2,584,483 14,829,975 11 2018 14,829.975 4,325,929 1.482.998 2.842,931 11,987.044 12 2019 11,987,044 4,325,929 1.198,704 3,127,225 8.859,819 13 2020 8.859,819 4,325,929 885,982 3,439,947 5.419.872 14 2021 5,419,872 4,325,929 541.987 3,783.942 1,635,930 15 2022 1,635,930 4.325,929 163,593 1,635,930 11 Central Maine Hydro Amortization of Term Loan 17 2024 1 2 3 4 5 6 Beginning Bal. 7 Payment 8 - Interest - - Principal L0 Ending Bal. 1 2 1 2008 28,202.880 926,985 705,072 221,913 27.980.967 2 2009 27,980.967 3,707,939 2.798,097 909,842 27,071,125 3 2010 27,071,125 3,707,939 2,707,112 1.000.827 26,070,298 4 2011 26,070,298 3,707,939 2.607.030 1.100.909 24,969,389 5 2012 24,969,389 3,707,939 2.496,939 1,211,000 23,758,388 6 2013 23,758,388 3,707,939 2,375.839 1,332.100 22,426,288 7 2014 22,426,288 3,707,939 2,242,629 1,465,310 20,960.978 8 2015 20.960,978 3,707,939 2,096,098 1.611,841 19,349,136 9 9 2016 19,349,136 3,707,939 1,934,914 1,773,026 17,576,111 10 2017 17,576,111 3,707,939 1,757,611 1,950,328 15,625,783 11 2018 15.625,783 3,707,939 1,562,578 2.145.361 13,480,422 12 2019 13,480,422 3,707,939 1,348,042 2,359,897 11,120,525 13 2020 11.120.525 3.707,939 1,112,053 2,595.887 8.524.638 14 2021 8.524.638 3,707,939 852,464 2.855,475 5,669.163 15 2022 5,669.163 3,707,939 566,916 3,141,023 2,528,140 16 2023 2,528,140 3,707,939 252,814 2,528.140 A 1 Central Maine Hydro 2 Projected Partnership Capital Structure 3 Construction Period 4 Projected Maximum 5 Construction Loan 43.263 44.263 6 Equity - GP 0.010 7 Equity - LPs 0.950 8 Total Equity 0.960 0.960 9 Total Construction Period Capital 44.223 45.223 10 Construction Period interest plus working capital 2.782 3.251 11 Total Startup Cost 47.005 48.474 12 Operating Startup (assuming maximum expenditures) 13 Term Loan % 60% 70% 14 Term Loan 29.084 33.932 15 Equity 16 - GP 0.194 0.145 1% 17 - LP's 19.196 14.397 99% 18 Total Equity 19.390 14.542 19 20 Total Capital 48.474 48.474 21 Operating Startup (assuming projected expenditures) 22 Term Loan % 60% 70% 23 Term Loan 28.203 32.903 24 Equity: 25 - GP 0.188 0.141 1% 26 - LP's 18.614 13.960 99% 27 Total Equity 18.802 14.101 28 29 Total Capital 47.005 47.005 20 0 P Q Annual Energy Generation in MWH MWH Historical Average Plant Average A 1 2 3 4 Year 6 1958 7 1959 8 1960 9 1961 10 1962 11 1963 2 1964 13 1965 14 1966 15 1967 16 1968 17 1969 8 1970 19 1971 20 1972 21 1973 22 1974 23 1975 24 1976 25 1977 26 1978 27 1979 28 1980 29 1981 30 1982 31 1983 B2 1984 33 1985 84 1986 85 1987 36 1988 87 1989 88 1990 39 1991 40 1992 11 1993 12 1994 13 1995 44 1996 15 1997 16 1998 47 1999 48 2000 49 2001 50 2002 51 2003 52 2004 3 2005 54 55 Avg. 56 B C D E F G . I J K L M N Central Maine Hydro Annual Energy Generation Based on Historical Flor Records (in Megav att Hours) Energy 89,316 87,975 79,411 88,343 120,000 75,687 92,018 96,275 110,000 84,440 80,654 69,918 73,228 100,000 83,964 84,692 91,395 90,000 92,395 95,503 64,662 80,000 76,963 74,292 100,018 102,228 70,000 81,860 102,978 111,072 60,000 86,023 78,190 98,241 50,000 93,580 106,722 1 5 9 13 17 21 25 29 33 37 41 45 49 92,921 89,416 104,630 96,615 73,374 89,361 94,095 99,126 87,677 104, 118 90,811 83,219 104,014 109,236 98,026 101,386 101,802 110,483 82,570 Year 90,512 A B H I J K I 1 D E F G Central Maine Hydro Electricity Price per KWH 2 3 2005 2006 2007 2008 2009 2010 2011 2012 2013 2014 4 MP Forecast Avg. 5 Price 6 Contract Price 7 Pessimistic Case 7.00 7.80 7.58 8.40 8.16 6.80 9.00 8.75 8.00 9.50 9.23 8.41 9.90 9.62 8.83 10.40 10.11 9.27 10.70 10.40 9.73 11.20 10.88 10.22 11.70 11.37 10.73 8 9 E 1 2 A B D F G H 1 Central Maine Hydro 2 Construction Loan Draw Schedule 3 (in MS) 4 # Month Year Draw Cumulative 14 10 July 1,500 12.046 15 11 August 1,424 13.470 16 12 September 1,511 14,981 17 13 October 1.628 16.609 18 14 November 1,615 18,224 19 15 December 1.841 20.065 2016 January 2007 1,947 22.012 21 17 February 976 22,988 22 18 March 612 23,600 23 19 April 1,260 24.860 24 20 May 1,267 26,127 25 21 June 1,709 27.836 26 22 July 1,631 29,467 27 23 August 1,398 30.865 28 24 September 1,385 32,250 29 25 October 1,274 33,524 30 26 November 1.227 34.751 31 27 December 1,371 36,122 32 28 January 2008 1,393 37,515 33 29 February 857 38,372 34 30 March 907 39,279 35 31 April 927 40,206 36 32 May 4.057 44.263 37 38 Note: All draws occurring between the Closing and Oct. 2005 are assumed to occur during Oct. 2005. 39 F G H I J K L M N O P Q R DE D Central Maine Hydro 210,000 Annual Energy Generation in MWH 29.015.776 650.000 2,000,000 31,665,776 Soft Costs: Construction insurance Brandeis payments: Land and water rights Cost reimbursement Construction period rent 120,000 500,000 500,000 1,500,000 2,500,000 110,000 900,243 400,000 32,966,019 100,000 CNH payments: General and administrative Fee MWH 90,000 A B 1 2 3 Hard Costs: 4 Construction, base 5 Construction, headpond 6 Contingencies 7 Total 8 9 Pending additions 10 Owner contingencies 11 Total 12 13 14 Hard and Soft Costs 15 16 17 18 19 20 21 22 23 24 25 26 27 28 500,000 920,000 1.420,000 630,000 1,340,000 48,483,787 80,000 Plant Average 70,000 Legal & accounting costs Banking & financing costs Construction period: Interest @10.5% Contingency - 100 bps Contingency - 1 month's interest Hedge fees Delay insurance 60,000 6,370.459 621,000 387,309 414,000 125,000 50,000 1 5 9 13 17 21 25 29 33 37 41 45 49 Year Working capital Contingency Debt service reserve 250,000 250,000 1,000,000 Total Soft Costs 15,517,768 B Central Hydro Projected Cash Flows 1 2 3 4. 5 6 7 Scenario - Base Case - Realistic power prices - 10% Term Loan Rate + B - 20 year Term Loan + C - 5% of Terminal Value + D LP Yield 11.5% 14.6% 15.0% 18.6% 19.3% Scenario A B D E GP Yield 39.8% 37.7% 36.6% 34.9% 34.4% 8 9 10