

Answered step by step
Verified Expert Solution
Question
1 Approved Answer
For this project, you will import the time and random modules. You will also install the matplotlib package and import from it the pyplot module.
For this project, you will import the time and random modules. You will also install the matplotlib package and import from it the pyplot module. You will also import the wraps function from the functools module for use in your decorator Use the time module to write a decorator function named sorttimer that times how many seconds it takes the decorated function to run. Since sort functions don't need to return anything, have the decorator's wrapper function return that elapsed time To get the current time, call time.perfcounter Subtracting the begin time from the end time will give you the elapsed time in seconds Copy the code for bubble sort and insertion sort from Module and decorate them with sorttimer. The names of the functions must be bubblesort and insertionsort. Write a function called makelistsofsorttimes that takes three parameters: two sort functions and a list of lengths which are ints It will return as a tuple two lists of times, one for each sort algorithm First it should randomly generate a list of n numbers, where n is the first value in the third parameter's list of lengths The random numbers should all be integers in the range r To generate random numbers, you will need to import the random module. The function call random.randinta b returns a random integer N such that a N b You should use a and b It's fine if values appear in the list multiple times Then the function should make a separate copy of your list of random numbers, which you can do like this: list listlist Making a separate copy of the list is necessary because if you call a sort function on the list to record how long it takes, the list will now be sorted, which would affect how long the other sort function takes Next the function should time how long it takes the first sort function to sort one copy of the list using the first parameter and then time how long it takes the second sort function to sort the other copy of the list using the second parameter This gets us the first data point for each algorithm's list of times The function should now repeat these steps for each of the remaining values in the third parameter's list of lengths. For each list size, the function should randomly generate a list of that size and time how long it takes each algorithm to sort it Once the function has completed a list of the time data points for each algorithm, it should return a tuple of the two lists first the list of sort times for the first sort function, then the list of sort times for the second sort function Keep in mind that the time it takes an algorithm to sort a list depends on the list. Some algorithms will sort some lists faster than others. If you wanted your graph to be more robust, you would generate say different random lists of each length and average their sort times together to get each data point. However, that would take significantly longer to run, and therefore for the TAs to grade, so for this assignment, stick to one list of each size Write a function called comparesorts that takes the two decorated sort functions as parameters. It should call the makelistsofsorttimes function to get the tuple of the two lists of times, and then generate a graph comparing the times for each sort algorithm The list it should pass to makelistsofsorttimes is HINT: because sorting all those lists can take a while, you might want to start with something smaller for your initial debugging, like To generate a graph, you will need to install the matplotlib package and import pyplot from it Below is an example of code to produce a graph comparing two series of data points you will need to modify it to graph your timing data from matplotlib import pyplot pyplot.plotro linewidth label'series pyplot.plotgo linewidth label'series pyplot.xlabelthe x label" pyplot.ylabelthe y label" pyplot.legendloc'upper left' pyplot.show Breakdown of graph example: Each of the calls to the plot function plots a line The call to the show function displays the graph In the calls to the plot function, the first list is the list of xcoordinates the lengths, which are the same for both curves you're plotting The second list is the list of ycoordinates the list of times for a particular algorithm The ro tells it to use red circles connected by a dashed line and go is the same except green instead of red The linewidth parameter is selfexplanatory The label parameter assigns the label to be used for that line in the legend. The legend function sets where on the graph the legend should be displayed The xlabel and ylabel functions set the labels for the x and y axes. For your graph, the x axis is the number of elements being sorte 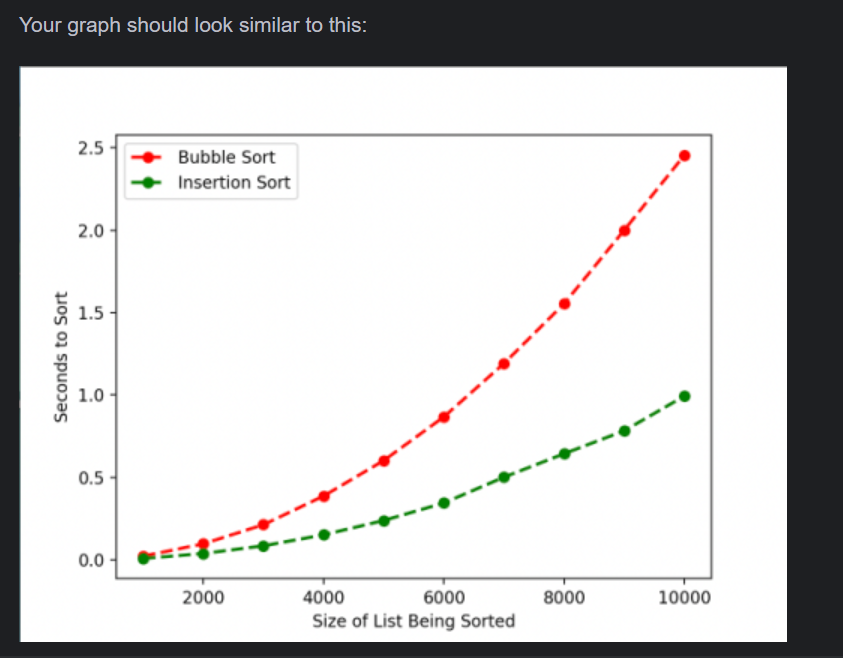
For this project, you will import the time and random modules. You will also install the matplotlib package and import from it the pyplot module. You will also import the wraps function from the functools module for use in your decorator
Use the time module to write a decorator function named sorttimer that times how many seconds it takes the decorated function to run. Since sort functions don't need to return anything, have the decorator's wrapper function return that elapsed time
To get the current time, call time.perfcounter Subtracting the begin time from the end time will give you the elapsed time in seconds
Copy the code for bubble sort and insertion sort from Module and decorate them with sorttimer. The names of the functions must be bubblesort and insertionsort.
Write a function called makelistsofsorttimes that takes three parameters: two sort functions and a list of lengths which are ints It will return as a tuple two lists of times, one for each sort algorithm
First it should randomly generate a list of n numbers, where n is the first value in the third parameter's list of lengths
The random numbers should all be integers in the range r
To generate random numbers, you will need to import the random module. The function call random.randinta b returns a random integer N such that a N b You should use a and b It's fine if values appear in the list multiple times
Then the function should make a separate copy of your list of random numbers, which you can do like this: list listlist
Making a separate copy of the list is necessary because if you call a sort function on the list to record how long it takes, the list will now be sorted, which would affect how long the other sort function takes
Next the function should time how long it takes the first sort function to sort one copy of the list using the first parameter and then time how long it takes the second sort function to sort the other copy of the list using the second parameter This gets us the first data point for each algorithm's list of times
The function should now repeat these steps for each of the remaining values in the third parameter's list of lengths. For each list size, the function should randomly generate a list of that size and time how long it takes each algorithm to sort it
Once the function has completed a list of the time data points for each algorithm, it should return a tuple of the two lists first the list of sort times for the first sort function, then the list of sort times for the second sort function
Keep in mind that the time it takes an algorithm to sort a list depends on the list. Some algorithms will sort some lists faster than others. If you wanted your graph to be more robust, you would generate say different random lists of each length and average their sort times together to get each data point. However, that would take significantly longer to run, and therefore for the TAs to grade, so for this assignment, stick to one list of each size
Write a function called comparesorts that takes the two decorated sort functions as parameters. It should call the makelistsofsorttimes function to get the tuple of the two lists of times, and then generate a graph comparing the times for each sort algorithm
The list it should pass to makelistsofsorttimes is
HINT: because sorting all those lists can take a while, you might want to start with something smaller for your initial debugging, like
To generate a graph, you will need to install the matplotlib package and import pyplot from it Below is an example of code to produce a graph comparing two series of data points you will need to modify it to graph your timing data
from matplotlib import pyplot
pyplot.plotro linewidth label'series
pyplot.plotgo linewidth label'series
pyplot.xlabelthe x label"
pyplot.ylabelthe y label"
pyplot.legendloc'upper left'
pyplot.show
Breakdown of graph example:
Each of the calls to the plot function plots a line
The call to the show function displays the graph
In the calls to the plot function, the first list is the list of xcoordinates the lengths, which are the same for both curves you're plotting The second list is the list of ycoordinates the list of times for a particular algorithm
The ro tells it to use red circles connected by a dashed line and go is the same except green instead of red
The linewidth parameter is selfexplanatory
The label parameter assigns the label to be used for that line in the legend. The legend function sets where on the graph the legend should be displayed
The xlabel and ylabel functions set the labels for the x and y axes. For your graph, the x axis is the number of elements being sorte
Step by Step Solution
There are 3 Steps involved in it
Step: 1

Get Instant Access to Expert-Tailored Solutions
See step-by-step solutions with expert insights and AI powered tools for academic success
Step: 2

Step: 3
Ace Your Homework with AI
Get the answers you need in no time with our AI-driven, step-by-step assistance
Get Started
Essential Data Protection For Estate Agencies In Singapore 2024
Authors: Yang Yen Thaw Yt
1st Edition
B0CQK79WD3, 979-8872095392