Answered step by step
Verified Expert Solution
Link Copied!

Question

1 Approved Answer

For this question use the following information: Data Display Row IQ Score Mus.Apt. 95 30 106 37 110 35 104 28 98 17 114 123
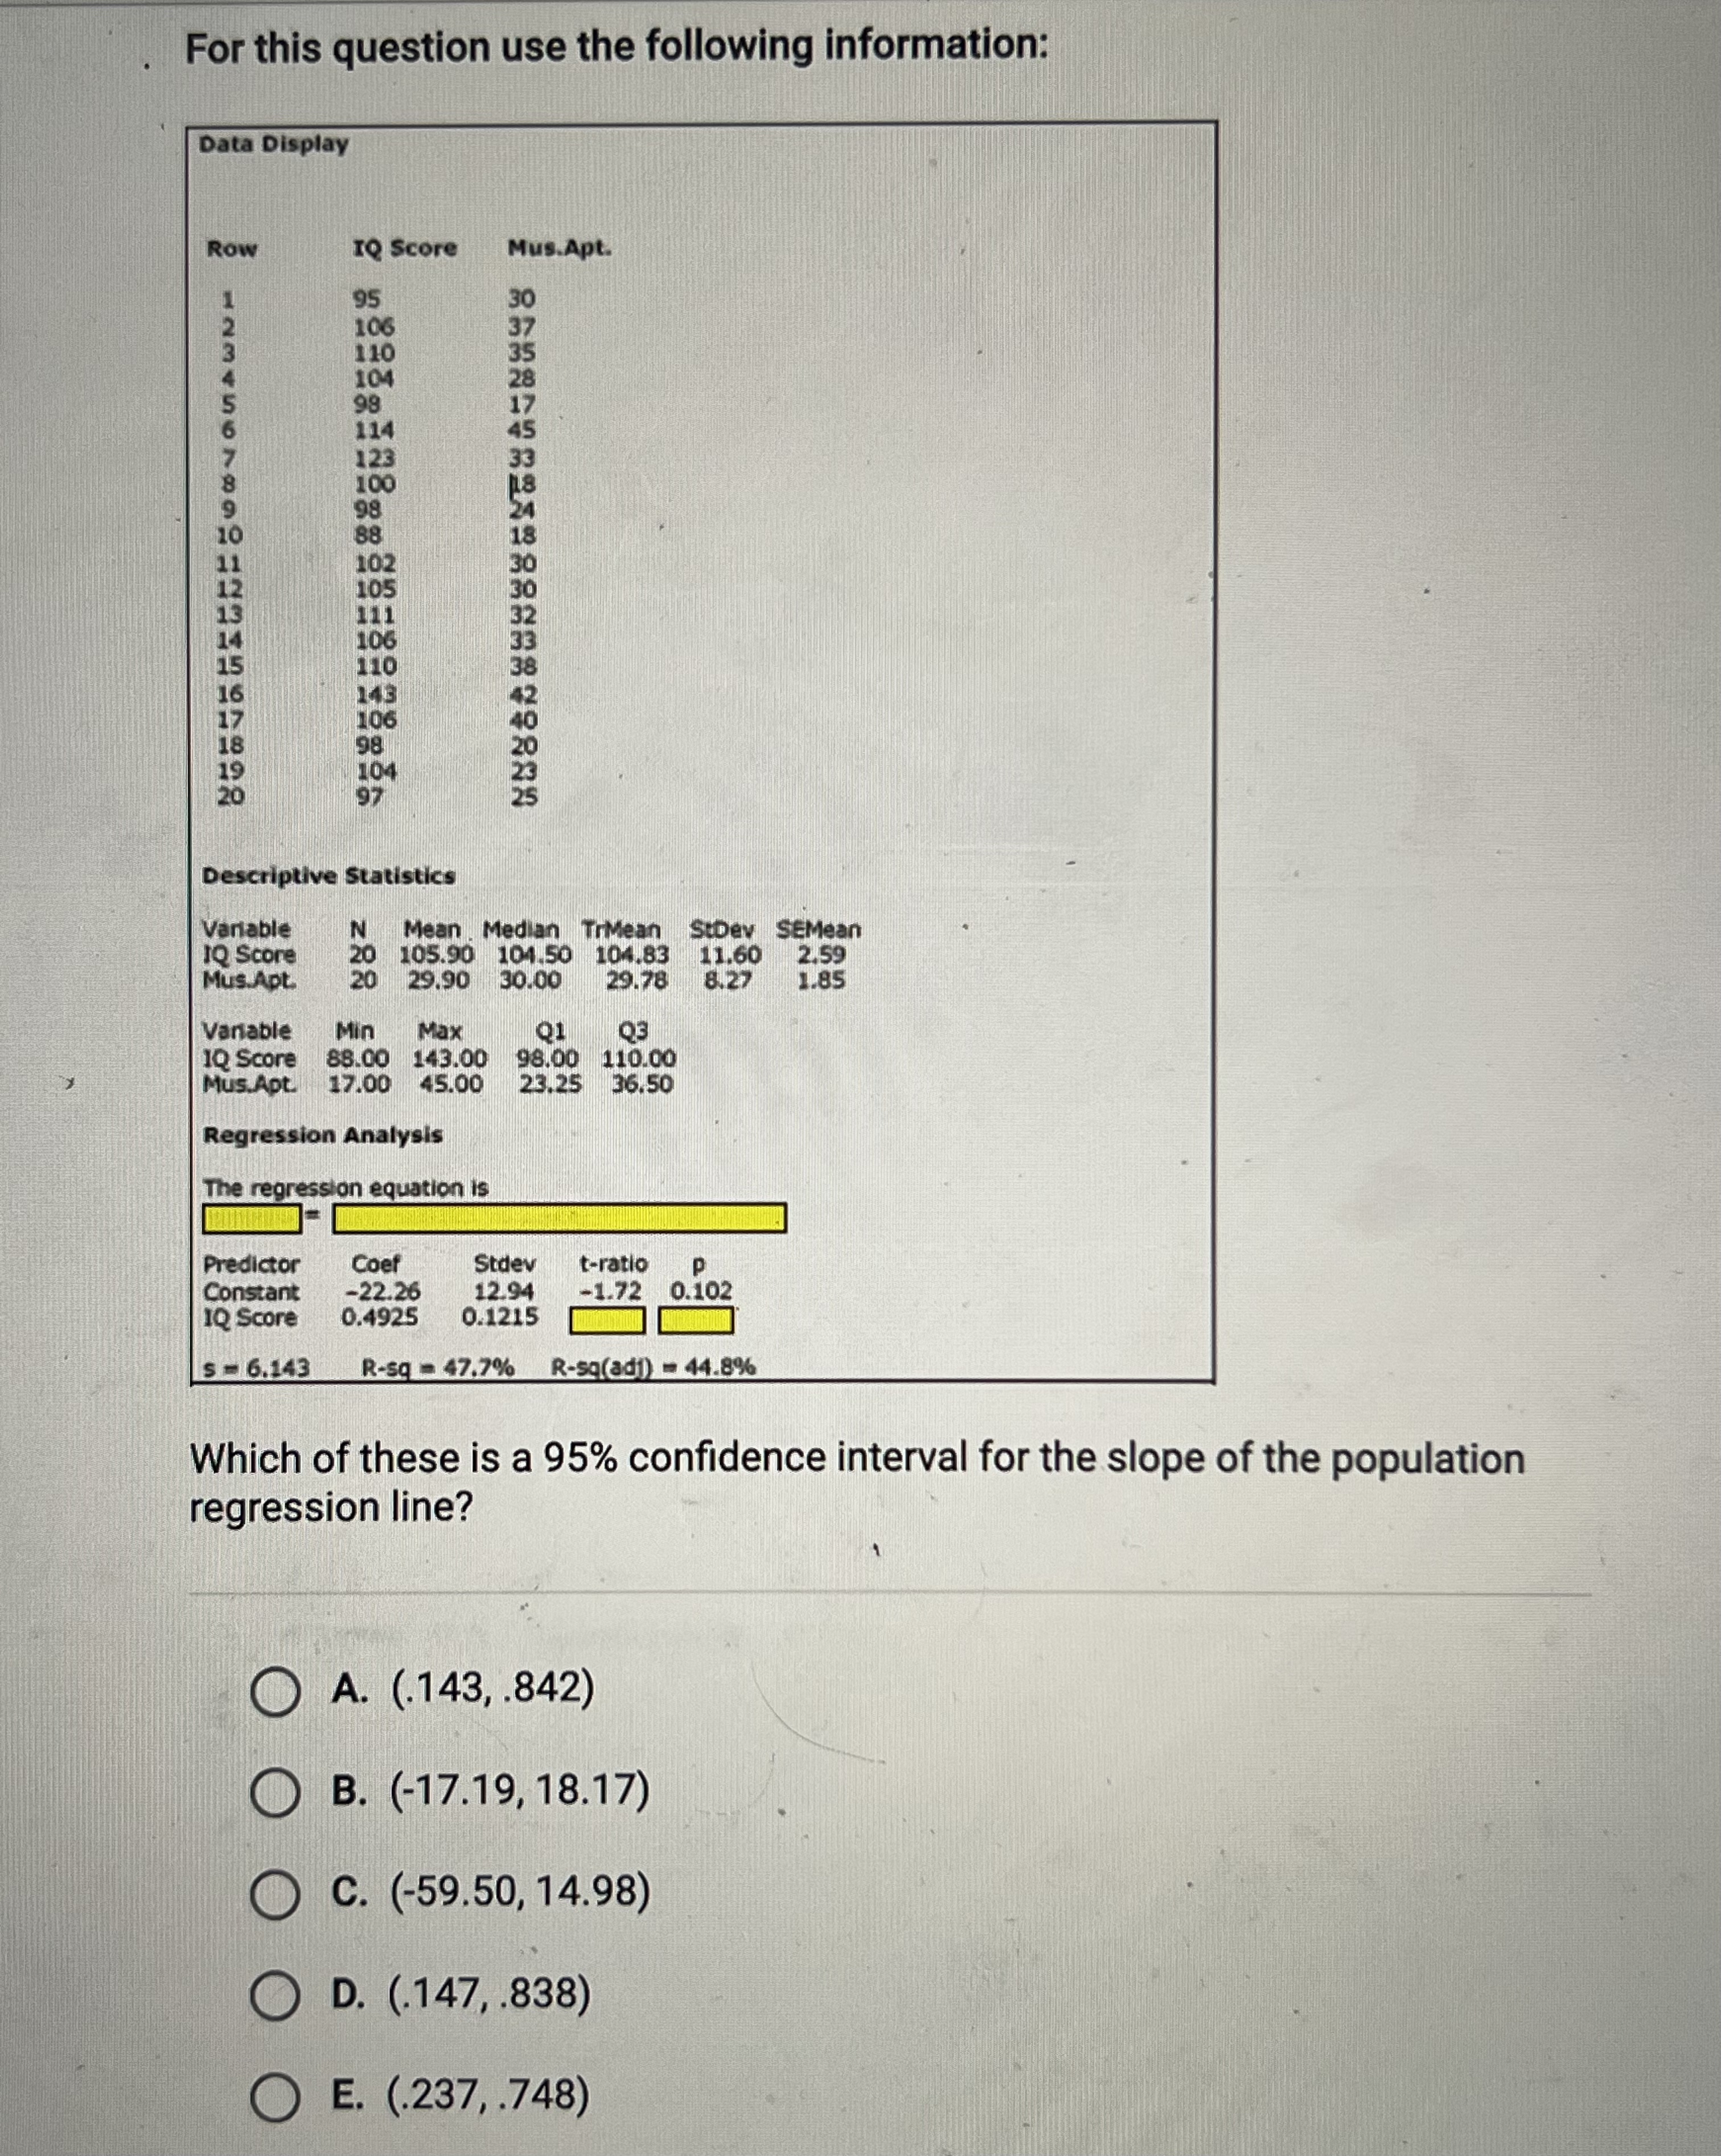
image text in transcribed
For this question use the following information: Data Display Row IQ Score Mus.Apt. 95 30 106 37 110 35 104 28 98 17 114 123 100 98 102 98 Descriptive Statistics Variable Mean Median TrMean StDev SEMean 1Q Score 20 105.90 104.50 104.83 11.60 2.59 Mus.Apt. 20 29.90 30.00 29.78 8.27 1.85 vanable Min Max Q1 03 1Q Score 88.00 143.00 98.00 110.00 Mus.Apt. 17.00 45.00 23.25 36.50 Regression Analysis The regression equation is Predictor Coef Stdev t-ratio Constant -22.26 12.94 -1.72 0.102 1Q Score 0.4925 0.1215 S = 6.143 R-sq = 47.7% R-sq(adj) = 44.8% Which of these is a 95% confidence interval for the slope of the population regression line? A. (.143, .842) B. (-17.19, 18.17) c. (-59.50, 14.98) D. (.147, .838) O E. (.237, .748)

Step by Step Solution

There are 3 Steps involved in it

Step: 1

blur-text-image

Get Instant Access to Expert-Tailored Solutions

See step-by-step solutions with expert insights and AI powered tools for academic success

Step: 2

blur-text-image_2

Step: 3

blur-text-image_3

Ace Your Homework with AI

Get the answers you need in no time with our AI-driven, step-by-step assistance

Get Started

Recommended Textbook for

Combinatorial Dynamics And Entropy In Dimension One

Authors: Lluis Alseda, Jaume Llibre, Michal Misiurewicz

1st Edition

9810213441, 9789810213442

More Books

Students also viewed these Mathematics questions

Question

Distinguish between a twitch and a sustained contraction.

Answered: 1 week ago