

Question
For this question, we will use the following tabulated monthly return data (similar to what you worked for #3in your first assignment): a. Calculate the
For this question, we will use the following tabulated monthly return data (similar to what you worked for #3in your first assignment):
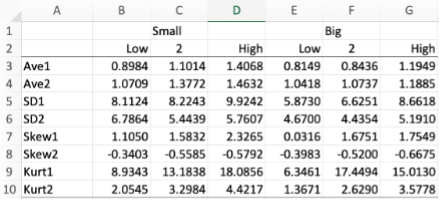
a. Calculate the average monthly return premium on the SMB and HML portfolios in the second period (1971-2021). For example, SMB will be given by [(B4+C4+D4)(E4+F4+G4)]/3. Similarly, HML will be given by[(D4B4) + (G4E4)]/2, i.e., the average of the two differences observed. Convert the monthly premiums to annual rates by using the following formula: Note: All the returns in the table above are in percentages. Always perform mathematical operations using numbers in decimal format, in this case, the values divided by 100.
b. Recall the 3-factor FF model: State the risk/return relationship above if the annual risk-free rate is 2% and the return on the market portfolio is 6.5%.
c. You are valuing a company using the Gordon Growth Model with constant growth rate of 3%, and the most recent dividend payment of $1 per share. Find the fair market value of the company using the CAPM model if the stock has a beta of 1.2.
d. Using the same company and data as in part (c), compute the fair value of the company, if the SMB beta is-0.2, and the HML beta is 0.7. Contrast your finding to that of part (c). What do you conclude? Can you characterize this company with the data available?
\begin{tabular}{|l|rrrrrrrr} & \multicolumn{1}{|c}{ A } & B & C & D & E & F & G \\ \hline 1 & & \multicolumn{2}{c}{ Small } & & \multicolumn{2}{c}{ Big } & \\ \hline 2 & & Low & 2 & High & Low & 2 & High \\ \hline 3 & Ave1 & 0.8984 & 1.1014 & 1.4068 & 0.8149 & 0.8436 & 1.1949 \\ \hline 4 & Ave2 & 1.0709 & 1.3772 & 1.4632 & 1.0418 & 1.0737 & 1.1885 \\ \hline 5 & SD1 & 8.1124 & 8.2243 & 9.9242 & 5.8730 & 6.6251 & 8.6618 \\ \hline 6 & SD2 & 6.7864 & 5.4439 & 5.7607 & 4.6700 & 4.4354 & 5.1910 \\ \hline 7 & Skew1 & 1.1050 & 1.5832 & 2.3265 & 0.0316 & 1.6751 & 1.7549 \\ \hline 8 & Skew2 & -0.3403 & -0.5585 & -0.5792 & -0.3983 & -0.5200 & -0.6675 \\ \hline 9 & Kurt1 & 8.9343 & 13.1838 & 18.0856 & 6.3461 & 17.4494 & 15.0130 \\ \hline 10 & Kurt2 & 2.0545 & 3.2984 & 4.4217 & 1.3671 & 2.6290 & 3.5778 \\ \hline \end{tabular} \begin{tabular}{|l|rrrrrrrr} & \multicolumn{1}{|c}{ A } & B & C & D & E & F & G \\ \hline 1 & & \multicolumn{2}{c}{ Small } & & \multicolumn{2}{c}{ Big } & \\ \hline 2 & & Low & 2 & High & Low & 2 & High \\ \hline 3 & Ave1 & 0.8984 & 1.1014 & 1.4068 & 0.8149 & 0.8436 & 1.1949 \\ \hline 4 & Ave2 & 1.0709 & 1.3772 & 1.4632 & 1.0418 & 1.0737 & 1.1885 \\ \hline 5 & SD1 & 8.1124 & 8.2243 & 9.9242 & 5.8730 & 6.6251 & 8.6618 \\ \hline 6 & SD2 & 6.7864 & 5.4439 & 5.7607 & 4.6700 & 4.4354 & 5.1910 \\ \hline 7 & Skew1 & 1.1050 & 1.5832 & 2.3265 & 0.0316 & 1.6751 & 1.7549 \\ \hline 8 & Skew2 & -0.3403 & -0.5585 & -0.5792 & -0.3983 & -0.5200 & -0.6675 \\ \hline 9 & Kurt1 & 8.9343 & 13.1838 & 18.0856 & 6.3461 & 17.4494 & 15.0130 \\ \hline 10 & Kurt2 & 2.0545 & 3.2984 & 4.4217 & 1.3671 & 2.6290 & 3.5778 \\ \hline \end{tabular}Step by Step Solution
There are 3 Steps involved in it
Step: 1

Get Instant Access to Expert-Tailored Solutions
See step-by-step solutions with expert insights and AI powered tools for academic success
Step: 2

Step: 3
Ace Your Homework with AI
Get the answers you need in no time with our AI-driven, step-by-step assistance
Get Started
Venture Capital Islamic Finance And SMEs Valuation Structuring And Monitoring Practices In India
Authors: M. Durrani, G. Boocock
1st Edition
1403936382,0230626254