Question
ForceRun: 0 368.744 702.976 1002.696 1267.904 1498.6 1694.784 1856.456 1983.616 2076.264 2134.4 2158.024 2147.136 2101.736 2021.824 1907.4 1758.464 1575.016 1357.056 1104.584 817.6 496.104 140.096 ForceWalk:

ForceRun:
0 368.744 702.976 1002.696 1267.904 1498.6 1694.784 1856.456 1983.616 2076.264 2134.4 2158.024 2147.136 2101.736 2021.824 1907.4 1758.464 1575.016 1357.056 1104.584 817.6 496.104 140.096
ForceWalk:
0 147.67608 279.39864 396.18666 499.02912 588.885 666.68328 733.32294 789.67296 836.57232 874.83 905.22498 928.50624 945.39276 956.57352 962.7075 964.42368 962.32104 956.96856 948.90522 938.64 926.65188 913.38984 899.27286 884.68992 870 855.53208 841.58514 828.42816 816.30012 805.41 795.93678 788.02944 781.80696 777.35832 774.7425 773.98848 775.09524 778.03176 782.73702 789.12 797.05968 806.40504 816.97506 828.55872 840.915 853.77288 866.83134 879.75936 892.19592 903.75 914.00058 922.49664 928.75716 932.27112 932.4975 928.86528 920.77344 907.59096 888.65682 863.28 830.73948 790.28424 741.13326 682.47552 613.47 533.24568 440.90154 335.50656 216.09972 81.69
TimeRun:
0 0.01 0.02 0.03 0.04 0.05 0.06 0.07 0.08 0.09 0.1 0.11 0.12 0.13 0.14 0.15 0.16 0.17 0.18 0.19 0.2 0.21 0.22
TimeWalk:
0 0.01 0.02 0.03 0.04 0.05 0.06 0.07 0.08 0.09 0.1 0.11 0.12 0.13 0.14 0.15 0.16 0.17 0.18 0.19 0.2 0.21 0.22 0.23 0.24 0.25 0.26 0.27 0.28 0.29 0.3 0.31 0.32 0.33 0.34 0.35 0.36 0.37 0.38 0.39 0.4 0.41 0.42 0.43 0.44 0.45 0.46 0.47 0.48 0.49 0.5 0.51 0.52 0.53 0.54 0.55 0.56 0.57 0.58 0.59 0.6 0.61 0.62 0.63 0.64 0.65 0.66 0.67 0.68 0.69 0.7
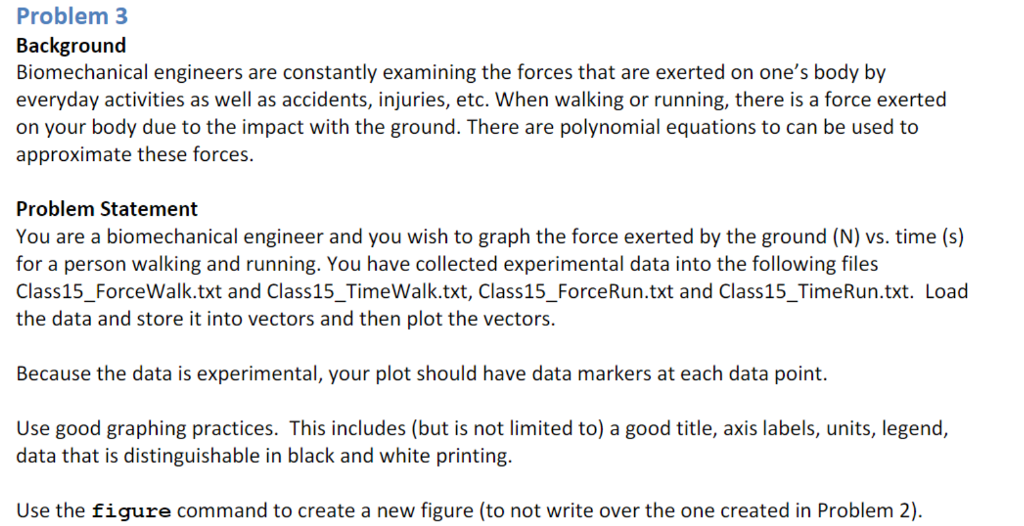
Problem 3 Background Biomechanical engineers are constantly examining the forces that are exerted on one's body by everyday activities as well as accidents, injuries, etc. When walking or running, there is a force exerted on your body due to the impact with the ground. There are polynomial equations to can be used to approximate these forces. Problem Statement You are a biomechanical engineer and you wish to graph the force exerted by the ground (N) vs. time (s) for a person walking and running. You have collected experimental data into the following files Class15_ForceWalk.txt and Class15_TimeWalk.txt, Class15_ForceRun.txt and Class15_TimeRun.txt. Load the data and store it into vectors and then plot the vectors. Because the data is experimental, your plot should have data markers at each data point. Use good graphing practices. This includes (but is not limited to) a good title, axis labels, units, legend, data that is distinguishable in black and white printing. Use the figure command to create a new figure (to not write over the one created in Problem 2)Step by Step Solution
There are 3 Steps involved in it
Step: 1

Get Instant Access to Expert-Tailored Solutions
See step-by-step solutions with expert insights and AI powered tools for academic success
Step: 2

Step: 3

Ace Your Homework with AI
Get the answers you need in no time with our AI-driven, step-by-step assistance
Get Started


