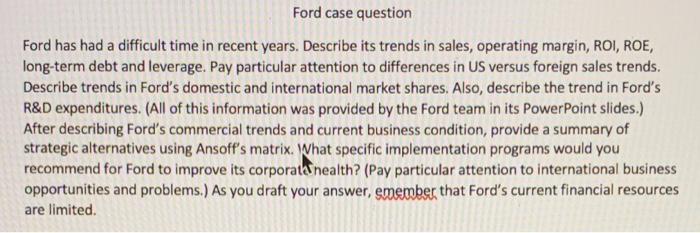
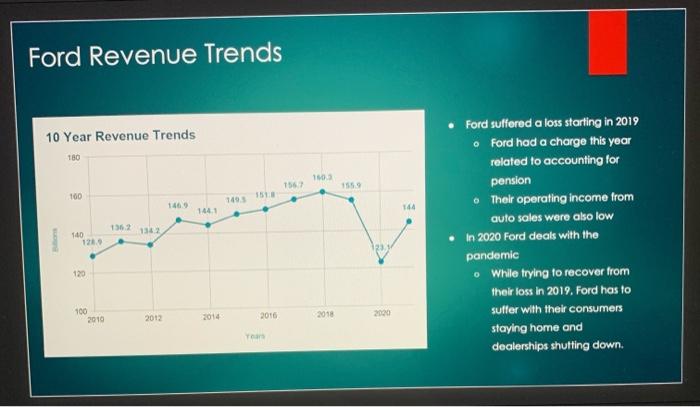
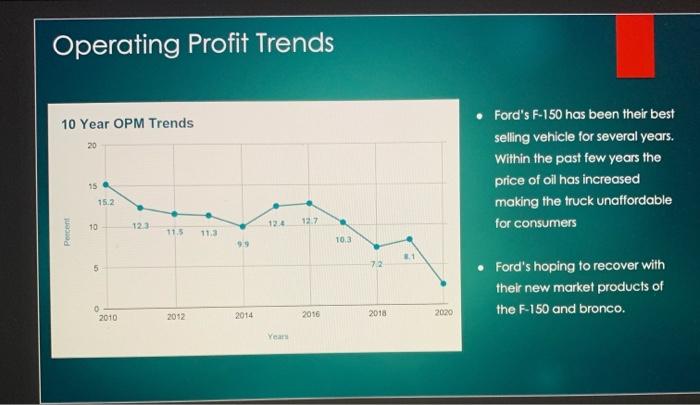
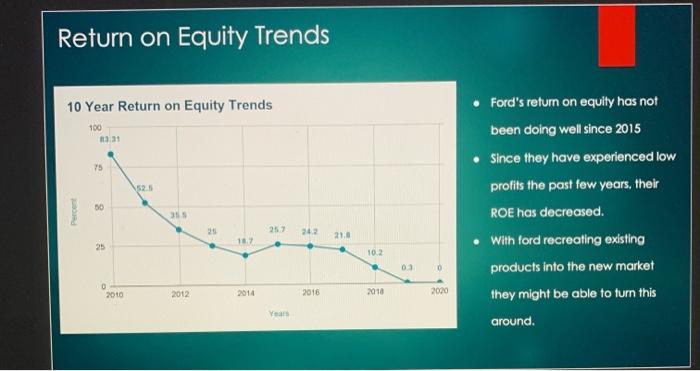
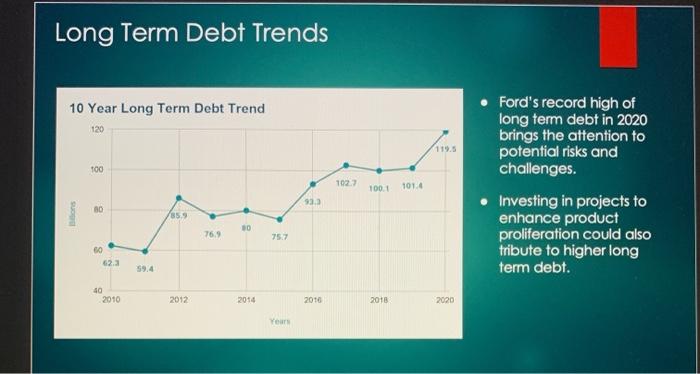
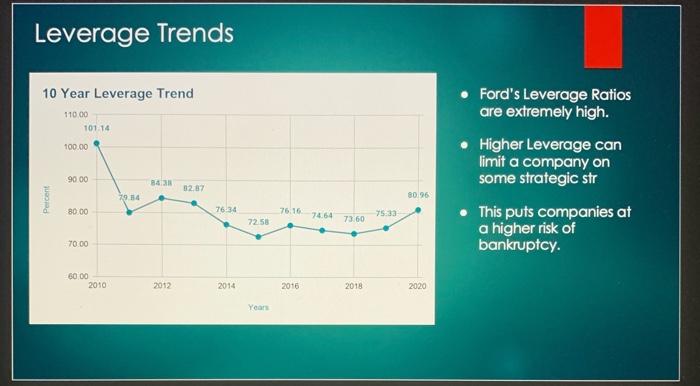
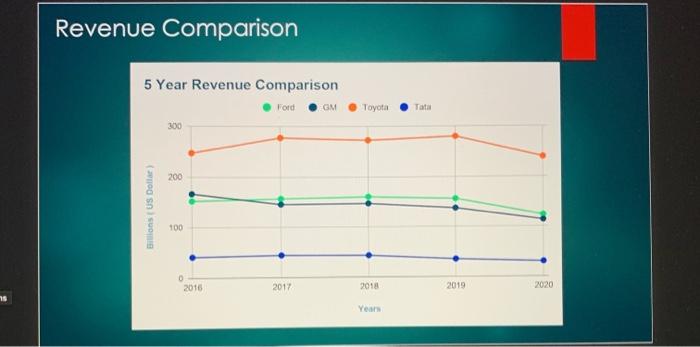
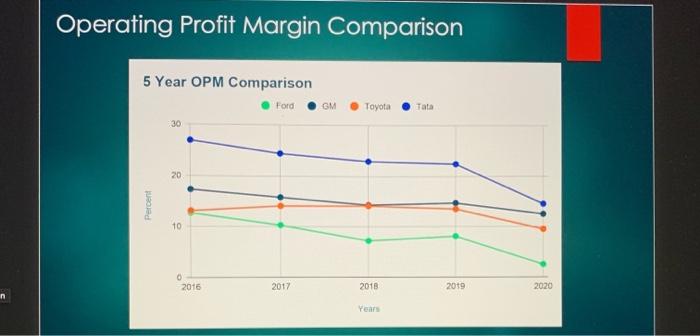
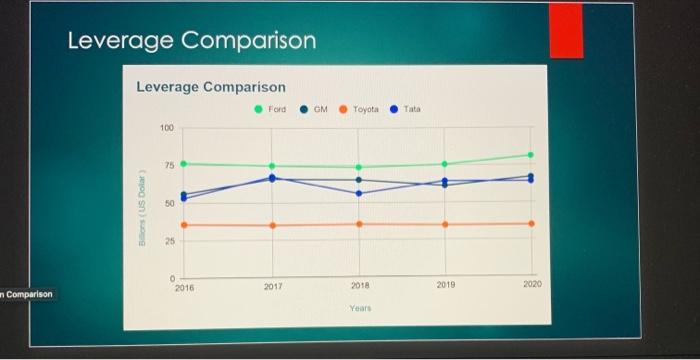
Ford case question Ford has had a difficult time in recent years. Describe its trends in sales, operating margin, ROI, ROE, long-term debt and leverage. Pay particular attention to differences in US versus foreign sales trends. Describe trends in Ford's domestic and international market shares. Also, describe the trend in Ford's R&D expenditures. (All of this information was provided by the Ford team in its Power Point slides.) After describing Ford's commercial trends and current business condition, provide a summary of strategic alternatives using Ansoft's matrix. What specific implementation programs would you recommend for Ford to improve its corporata nealth? (Pay particular attention to international business opportunities and problems.) As you draft your answer, emember that Ford's current financial resources are limited Ford Revenue Trends 10 Year Revenue Trends 180 103 156 11 100 144 1441 1362 1342 140 121 Ford suffered a loss starting in 2019 Ford had a charge this year related to accounting for pension Their operating income from auto sales were also low In 2020 Ford deals with the pandemic While trying to recover from their loss in 2019. Ford has to suffer with their consumers staying home and dealerships shutting down. 120 100 2010 2012 2016 2018 Operating Profit Trends 10 Year OPM Trends 20 Ford's F-150 has been their best selling vehicle for several years. Within the past few years the price of oil has increased making the truck unaffordable for consumers 15 15.2 123 127 10 11.5 11.3 10.3 1 72 5 Ford's hoping to recover with their new market products of the F-150 and bronco. 0 2010 2012 2014 2016 2018 2020 Yeari Return on Investment Trends 10 Year Return on Investment Trends 20.0 Automakers have suffered going through the pandemic and it show= in this graph. 150, 16.5 13.2 100 Percent 1.6 50 7:4 73 Ford is hoping with their new existing products, the f-150 and bronco. their stock numbers will go back up 00 2010 2012 2014 2018 2018 2020 Year Return on Equity Trends 10 Year Return on Equity Trends 100 31 Y5 Ford's return on equity has not been doing well since 2015 Since they have experienced low profits the past few years, their ROE has decreased With ford recreating existing products into the new market they might be able to turn this 00 Perce 35 25.7 242 210 25 102 03 0 O 2010 2012 2016 2018 2000 around. Long Term Debt Trends 10 Year Long Term Debt Trend 120 119.5 100 1027 Ford's record high of long term debt in 2020 brings the attention to potential risks and challenges. Investing in projects to enhance product proliferation could also tribute to higher long term debt. 100.1 101.4 93.2 ons 30 85.9 10 76.9 75.7 60 62.3 59.4 40 2010 2012 2014 2016 2018 2020 Your Leverage Trends 10 Year Leverage Trend 110,00 101.14 100.00 Ford's Leverage Ratios are extremely high. Higher Leverage can limit a company on some strategic str This puts companies at a higher risk of bankruptcy. 90 00 32.87 29 14 80/96 Percent 80.00 76 34 76.16 74.64 75:33 725 73.60 70.00 60.00 2010 2012 2014 2016 2018 2020 Year Revenue Comparison 5 Year Revenue Comparison GM Toyota Tata 300 200 Bons US Dollar 100 O 2016 2017 2018 2019 2020 Year Operating Profit Margin Comparison 5 Year OPM Comparison Ford GM Toyota Tata 30 20 Percent 10 0 2016 2017 2018 2019 2020 n Year Leverage Comparison Leverage Comparison Ford GM Toyota 100 75 50 Bons US Dollar 25 2016 2017 2018 2019 2020 Comparison Year Ford case question Ford has had a difficult time in recent years. Describe its trends in sales, operating margin, ROI, ROE, long-term debt and leverage. Pay particular attention to differences in US versus foreign sales trends. Describe trends in Ford's domestic and international market shares. Also, describe the trend in Ford's R&D expenditures. (All of this information was provided by the Ford team in its Power Point slides.) After describing Ford's commercial trends and current business condition, provide a summary of strategic alternatives using Ansoft's matrix. What specific implementation programs would you recommend for Ford to improve its corporata nealth? (Pay particular attention to international business opportunities and problems.) As you draft your answer, emember that Ford's current financial resources are limited Ford Revenue Trends 10 Year Revenue Trends 180 103 156 11 100 144 1441 1362 1342 140 121 Ford suffered a loss starting in 2019 Ford had a charge this year related to accounting for pension Their operating income from auto sales were also low In 2020 Ford deals with the pandemic While trying to recover from their loss in 2019. Ford has to suffer with their consumers staying home and dealerships shutting down. 120 100 2010 2012 2016 2018 Operating Profit Trends 10 Year OPM Trends 20 Ford's F-150 has been their best selling vehicle for several years. Within the past few years the price of oil has increased making the truck unaffordable for consumers 15 15.2 123 127 10 11.5 11.3 10.3 1 72 5 Ford's hoping to recover with their new market products of the F-150 and bronco. 0 2010 2012 2014 2016 2018 2020 Yeari Return on Investment Trends 10 Year Return on Investment Trends 20.0 Automakers have suffered going through the pandemic and it show= in this graph. 150, 16.5 13.2 100 Percent 1.6 50 7:4 73 Ford is hoping with their new existing products, the f-150 and bronco. their stock numbers will go back up 00 2010 2012 2014 2018 2018 2020 Year Return on Equity Trends 10 Year Return on Equity Trends 100 31 Y5 Ford's return on equity has not been doing well since 2015 Since they have experienced low profits the past few years, their ROE has decreased With ford recreating existing products into the new market they might be able to turn this 00 Perce 35 25.7 242 210 25 102 03 0 O 2010 2012 2016 2018 2000 around. Long Term Debt Trends 10 Year Long Term Debt Trend 120 119.5 100 1027 Ford's record high of long term debt in 2020 brings the attention to potential risks and challenges. Investing in projects to enhance product proliferation could also tribute to higher long term debt. 100.1 101.4 93.2 ons 30 85.9 10 76.9 75.7 60 62.3 59.4 40 2010 2012 2014 2016 2018 2020 Your Leverage Trends 10 Year Leverage Trend 110,00 101.14 100.00 Ford's Leverage Ratios are extremely high. Higher Leverage can limit a company on some strategic str This puts companies at a higher risk of bankruptcy. 90 00 32.87 29 14 80/96 Percent 80.00 76 34 76.16 74.64 75:33 725 73.60 70.00 60.00 2010 2012 2014 2016 2018 2020 Year Revenue Comparison 5 Year Revenue Comparison GM Toyota Tata 300 200 Bons US Dollar 100 O 2016 2017 2018 2019 2020 Year Operating Profit Margin Comparison 5 Year OPM Comparison Ford GM Toyota Tata 30 20 Percent 10 0 2016 2017 2018 2019 2020 n Year Leverage Comparison Leverage Comparison Ford GM Toyota 100 75 50 Bons US Dollar 25 2016 2017 2018 2019 2020 Comparison Year