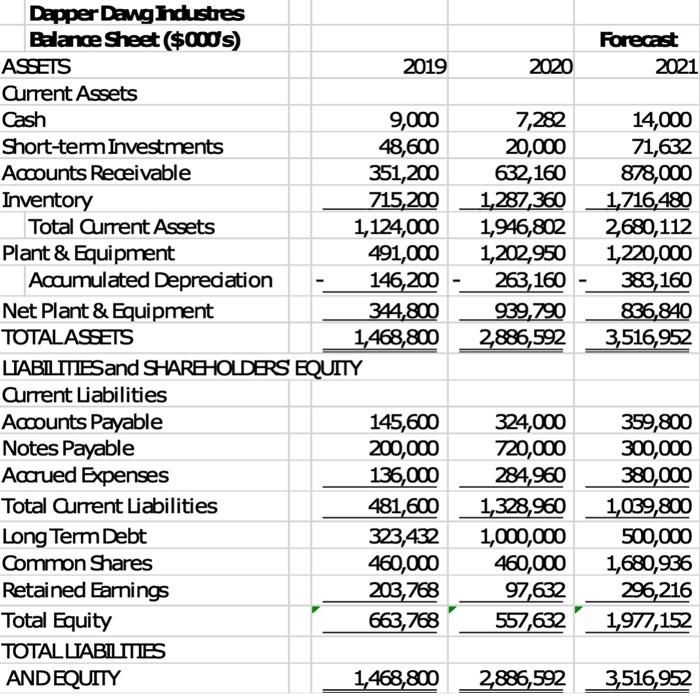
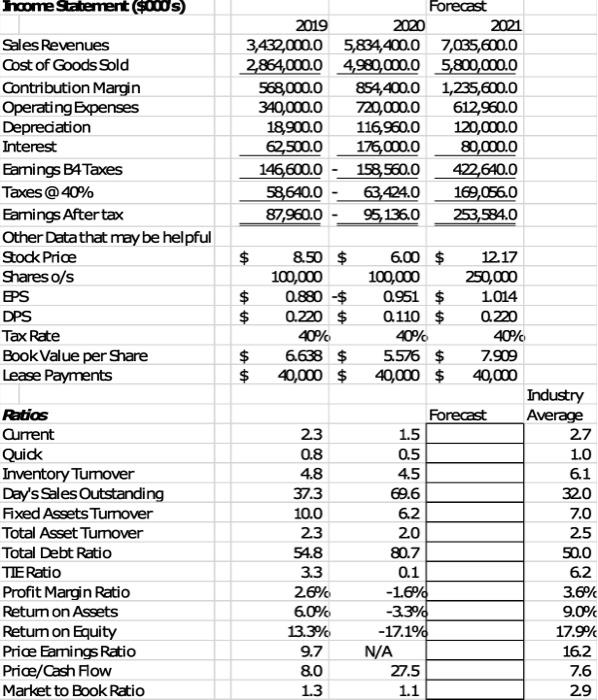
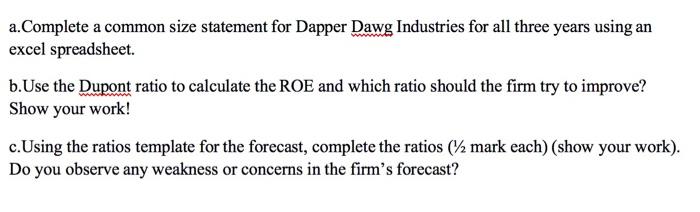
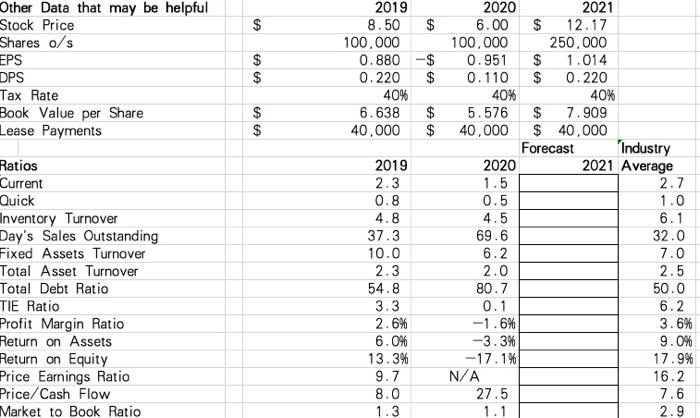
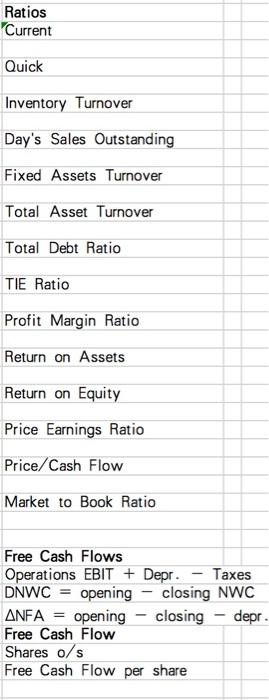
Forecast 2021 2020 Dapper Dang hdustres Balance Sheet($000s) ASSETS 2019 Current Assets Cash 9,000 Short-term Investments 48,600 Accounts Receivable 351,200 Inventory 715,200 Total Current Assets 1,124,000 Plant & Equipment 491,000 Accumulated Depreciation 146,200 Net Plant & Equipment 344,800 TOTALASSETS 1,468,800 LIABILITIES and SHAREHOLDERS EQUITY Current Liabilities Accounts Payable 145,600 Notes Payable 200,000 Accrued Expenses 136,000 Total Current Liabilities 481,600 Long Term Debt 323,432 Common Shares 460,000 Retained Earnings 203,768 Total Equity 663,768 TOTALLIABILITIES AND EQUITY 1,468,800 7,282 20,000 632,160 1,287,360 1,946,802 1,202,950 263,160 939,790 2,886,592 14,000 71,632 878,000 1,716,480 2680,112 1,220,000 383,160 836,840 3,516,952 324,000 720,000 284,960 1,328,960 1,000,000 460,000 97,632 557,632 359,800 300,000 380,000 1,039,800 500,000 1,680,936 296,216 1,977,152 2886,592 3,516,952 hcome Statement ($ows) Sales Revenues Cost of Goods Sold Contribution Margin Operating Expenses Depreciation Interest Earnings B4 Taxes Taxes @ 40% Earnings Aftertax Other Data that may be helpful Stock Price Shares o/s PS DPS Tax Rate Book Value per Share Lease Payments Forecast 2019 2020 2021 3,432,000.0 5,834,400.0 7,035,600.0 2864,000.0 4,980,000.0 5,800,000.0 568,000.0 854,400.0 1,235,600.0 340,000.0 720,000.0 612,960.0 18,900.0 116, 960.0 120,000.0 62,500.0 176,000.0 80,000.0 146,600.0 158,560.0 422,640.0 58,640.0 63,424.0 169,056.0 87,960.0 95, 136.0 253,584.0 $ $ $ 8.50 $ 100,000 0.880 -$ 0.220 $ 40% 6638 $ 40,000 $ $ A tA Ratios Current Quick Inventory Tumover Day's Sales Outstanding Fixed Assets Tumover Total Asset Tumover Total Debt Ratio TIE Ratio Profit Margin Ratio Return on Assets Retum on Equity Price Earnings Ratio Price/Cash Flow Market to Book Ratio 23 0.8 4.8 37.3 10.0 23 54.8 3.3 26% 60% 13.3% 9.7 8.0 6.00 $ 12.17 100,000 250,000 0951 $ 1.014 Q.110 $ 0.220 40% 40% 5.576 $ 7.909 40,000 $ 40,000 Industry Forecast Average 1.5 27 0.5 1.0 4.5 6.1 69.6 320 6.2 7.0 20 25 80.7 50.0 0.1 62 -1.6% 3.6% -33% 9.0% -17.1% 17.9% N/A 16.2 27.5 7.6 1.1 29 1.3 a.Complete a common size statement for Dapper Dawg Industries for all three years using an excel spreadsheet. b.Use the Dupont ratio to calculate the ROE and which ratio should the firm try to improve? Show your work! c. Using the ratios template for the forecast, complete the ratios (72 mark each) (show your work). Do you observe any weakness or concerns in the firm's forecast? $ $ Other Data that may be helpful Stock Price Shares os EPS DPS $ $ 2019 8.50 100.000 0.880 0.220 40% 6.638 40,000 -$ $ Tax Rate Book Value per Share Lease Payments $ $ $ $ Ratios Current Quick Inventory Turnover Day's Sales Outstanding Fixed Assets Turnover Total Asset Turnover Total Debt Ratio TIE Ratio Profit Margin Ratio Return on Assets Return on Equity Price Earnings Ratio Price/Cash Flow Market to Book Ratio 2019 2.3 0.8 4.8 37.3 10.0 2.3 54.8 3.3 2.6% 6.0% 13.3% 9.7 8.0 1.3 2020 2021 6.00 $ 12.17 100,000 250.000 0.951 $ 1.014 0.110 $ 0.220 40% 40% 5.576 $ 7.909 40,000 $ 40,000 Forecast 'Industry 2020 2021 Average 1.5 2.7 0.5 1.0 4.5 6.1 69.6 32.0 6.2 7.0 2.0 2.5 80.7 50.0 0.1 6.2 -1.6% 3.6% -3.3% 9.0% -17.1% 17.9% N/A 16.2 27.5 7.6 1.1 2.9 Ratios Current Quick Inventory Turnover Day's Sales Outstanding Fixed Assets Turnover Total Asset Turnover Total Debt Ratio TIE Ratio Profit Margin Ratio Return on Assets Return on Equity Price Earnings Ratio Price/Cash Flow Market to Book Ratio Free Cash Flows Operations EBIT + Depr. Taxes DNWC = opening closing NWC ANFA = opening closing - depr. Free Cash Flow Shares o/s Free Cash Flow per share Forecast 2021 2020 Dapper Dang hdustres Balance Sheet($000s) ASSETS 2019 Current Assets Cash 9,000 Short-term Investments 48,600 Accounts Receivable 351,200 Inventory 715,200 Total Current Assets 1,124,000 Plant & Equipment 491,000 Accumulated Depreciation 146,200 Net Plant & Equipment 344,800 TOTALASSETS 1,468,800 LIABILITIES and SHAREHOLDERS EQUITY Current Liabilities Accounts Payable 145,600 Notes Payable 200,000 Accrued Expenses 136,000 Total Current Liabilities 481,600 Long Term Debt 323,432 Common Shares 460,000 Retained Earnings 203,768 Total Equity 663,768 TOTALLIABILITIES AND EQUITY 1,468,800 7,282 20,000 632,160 1,287,360 1,946,802 1,202,950 263,160 939,790 2,886,592 14,000 71,632 878,000 1,716,480 2680,112 1,220,000 383,160 836,840 3,516,952 324,000 720,000 284,960 1,328,960 1,000,000 460,000 97,632 557,632 359,800 300,000 380,000 1,039,800 500,000 1,680,936 296,216 1,977,152 2886,592 3,516,952 hcome Statement ($ows) Sales Revenues Cost of Goods Sold Contribution Margin Operating Expenses Depreciation Interest Earnings B4 Taxes Taxes @ 40% Earnings Aftertax Other Data that may be helpful Stock Price Shares o/s PS DPS Tax Rate Book Value per Share Lease Payments Forecast 2019 2020 2021 3,432,000.0 5,834,400.0 7,035,600.0 2864,000.0 4,980,000.0 5,800,000.0 568,000.0 854,400.0 1,235,600.0 340,000.0 720,000.0 612,960.0 18,900.0 116, 960.0 120,000.0 62,500.0 176,000.0 80,000.0 146,600.0 158,560.0 422,640.0 58,640.0 63,424.0 169,056.0 87,960.0 95, 136.0 253,584.0 $ $ $ 8.50 $ 100,000 0.880 -$ 0.220 $ 40% 6638 $ 40,000 $ $ A tA Ratios Current Quick Inventory Tumover Day's Sales Outstanding Fixed Assets Tumover Total Asset Tumover Total Debt Ratio TIE Ratio Profit Margin Ratio Return on Assets Retum on Equity Price Earnings Ratio Price/Cash Flow Market to Book Ratio 23 0.8 4.8 37.3 10.0 23 54.8 3.3 26% 60% 13.3% 9.7 8.0 6.00 $ 12.17 100,000 250,000 0951 $ 1.014 Q.110 $ 0.220 40% 40% 5.576 $ 7.909 40,000 $ 40,000 Industry Forecast Average 1.5 27 0.5 1.0 4.5 6.1 69.6 320 6.2 7.0 20 25 80.7 50.0 0.1 62 -1.6% 3.6% -33% 9.0% -17.1% 17.9% N/A 16.2 27.5 7.6 1.1 29 1.3 a.Complete a common size statement for Dapper Dawg Industries for all three years using an excel spreadsheet. b.Use the Dupont ratio to calculate the ROE and which ratio should the firm try to improve? Show your work! c. Using the ratios template for the forecast, complete the ratios (72 mark each) (show your work). Do you observe any weakness or concerns in the firm's forecast? $ $ Other Data that may be helpful Stock Price Shares os EPS DPS $ $ 2019 8.50 100.000 0.880 0.220 40% 6.638 40,000 -$ $ Tax Rate Book Value per Share Lease Payments $ $ $ $ Ratios Current Quick Inventory Turnover Day's Sales Outstanding Fixed Assets Turnover Total Asset Turnover Total Debt Ratio TIE Ratio Profit Margin Ratio Return on Assets Return on Equity Price Earnings Ratio Price/Cash Flow Market to Book Ratio 2019 2.3 0.8 4.8 37.3 10.0 2.3 54.8 3.3 2.6% 6.0% 13.3% 9.7 8.0 1.3 2020 2021 6.00 $ 12.17 100,000 250.000 0.951 $ 1.014 0.110 $ 0.220 40% 40% 5.576 $ 7.909 40,000 $ 40,000 Forecast 'Industry 2020 2021 Average 1.5 2.7 0.5 1.0 4.5 6.1 69.6 32.0 6.2 7.0 2.0 2.5 80.7 50.0 0.1 6.2 -1.6% 3.6% -3.3% 9.0% -17.1% 17.9% N/A 16.2 27.5 7.6 1.1 2.9 Ratios Current Quick Inventory Turnover Day's Sales Outstanding Fixed Assets Turnover Total Asset Turnover Total Debt Ratio TIE Ratio Profit Margin Ratio Return on Assets Return on Equity Price Earnings Ratio Price/Cash Flow Market to Book Ratio Free Cash Flows Operations EBIT + Depr. Taxes DNWC = opening closing NWC ANFA = opening closing - depr. Free Cash Flow Shares o/s Free Cash Flow per share