Forecast Ideko's free cash flow (reproduce Table 19.10), assuming Ideko's market share will increase by 0.65 percent per year; investment, financing, and depreciation will be adjusted accordingly; and the projected improvements in working capital occur (that is, Ideko's working capital requirements through 2010 will be as shown here). Ideko's pro-forma income statements for 2005-2010 are shown here while its balance sheet for 2005 is shown here Ideko's production plant will require an expansion in 2010 (when production volume will exceed the current level by 50 % ),and the cost of this expansion will be $ 14.5 million. This amount will be borrowed from a financial institution at an interest rate of 6.7 % The new projected capital investments are shown here (Assume an income tax rate of 35% .)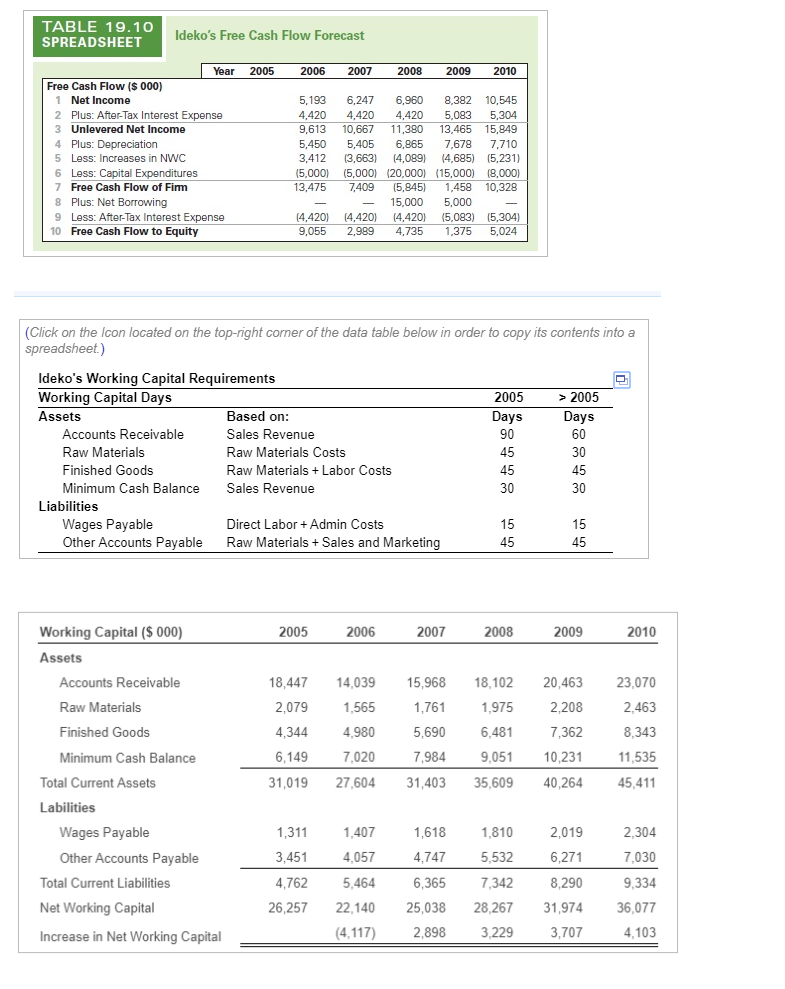
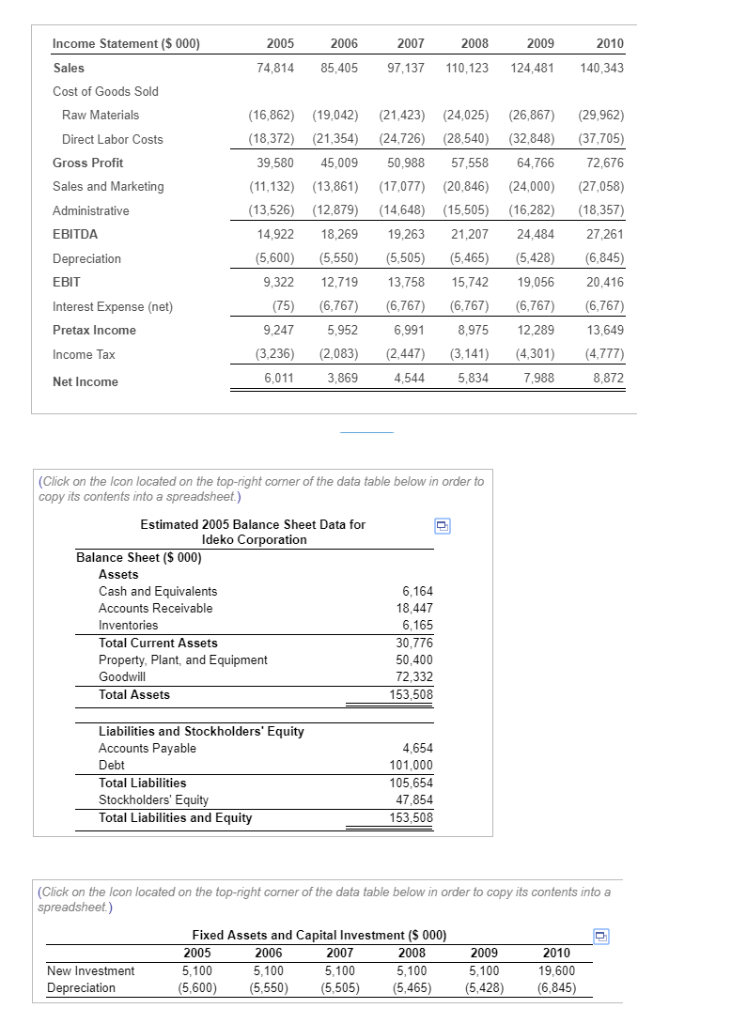
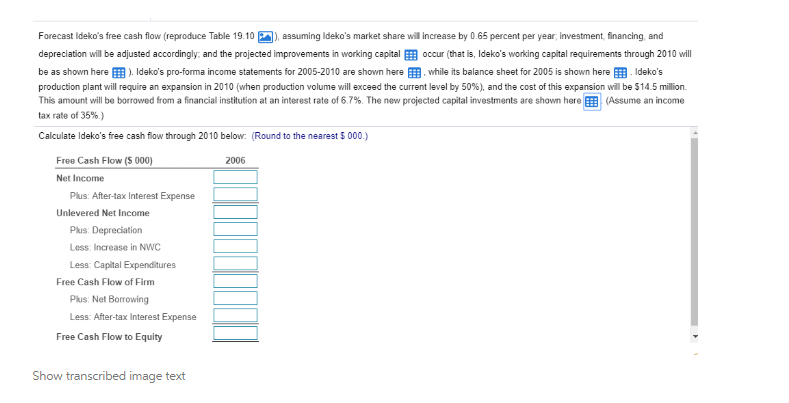
TABLE 19.10 SPREADSHEET Ideko's Free Cash Flow Forecast Year 2005 2006 2007 2008 2009 2010 Free Cash Flow ($ 000) 1 Net Income 2 Plus: After-Tax Interest Expense 3 Unlevered Net Income 4 Plus: Depreciation 5 Less: Increases in NWC 6 Less: Capital Expenditures 7 Free Cash Flow of Fim 8 Plus: Net Borrowing 9 Less: After-Tax Interest Expense 5,193 6,247 6,960 8,382 10,545 4,420 4,420 4,420 5,083 5,304 9,613 10,667 11,380 13.465 15,849 5,450 5,405 6,865 7,678 7,710 3,412 3,663 4,089) 4,685) (5,231) 5,000 5,000 (20,000) 15,000) (8,000) 13,475 7409 (5,845 1,458 10,328 15,000 5,000 4,420 4,420 4,420) 5,083) 5,304 9,055 2,989 4,735 1,375 5,024 10 Free Cash Flow to Equity (Click on the Icon located on the top-right corner of the data table below in order to copy its contents into a spreadsheet) Ideko's Working Capital Requirements Working Capital Days Assets 2005 > 2005 Accounts Receivable Raw Materials Finished Goods Minimum Cash Balance Based on: Sales Revenue Raw Materials Costs Raw Materials Labor Costs Sales Revenue 60 30 45 30 30 Liabilities Wages Pavable Direct LaborAdmin Costs Raw Materials +Sales and Marketing 15 Other Accounts Payable Working Capital ($ 000) 2005 2006 2007 2008 2009 2010 Assets Accounts Receivable Raw Materials Finished Goods Minimum Cash Balance 23,070 2463 8.343 11,535 1,019 27,60431,403 35,609 40,264 45,411 18,44714,039 15,968 18,102 20,463 1,975 2,208 7,362 9,051 10,231 2,079 4,344 6,149 1,565 4.980 7,020 1,761 5,690 7,984 6.481 Total Current Assets Labilities Wages Payable 2,304 7.030 9,334 6,257 22,14025,038 28,267 31,974 36,077 4,103 2,019 6,271 ,7625,4646,365 7,342 8,290 1,618 1,810 3,451 ,7475,532 Other Accounts Payable Total Current Liabilities Net Working Capital Increase in Net Working Capital 4,057 4,117) 2,898 3,229 3,707 Forecast Ideko's free cash flow (reproduce Table 19.10assuming Ideko's market share wil increase by 0.65 percent per year, investment, financing, and depreciation wil be adjusted according y: and the proected improvements in woning capital oco at s lde os w n g cap a requirement ra h 2010 wil be as shown here ldeko's pro forma income statements for 2005-2010 are shown here, while its balance sheet for 2005 is shown here ldeko's production plant will require an expansion in 2010 when production volume will exceed the current level by 50% and the cos of tis ex anson wil be S 45 m lon. This amount will be borrowed from a financial institution at an interest rate of 6 7% The new projected capital investments are shown hreE!Assumo anincomo tax rate of 35% ) Calculate Ideko's free cash flow through 2010 below: (Round to the nearest $ 000) Free Cash Flow (5 000) Net Income 2006 Plus: After-tax Interest Expense Unlevered Net Income Plus Depreciation Less Increase in NWC Less Caplital Expenditures Free Cash Flow of Firm Plus Net Borrowing Less: After-tax Interest Expense Free Cash Flow to Equity Show transcribed image text TABLE 19.10 SPREADSHEET Ideko's Free Cash Flow Forecast Year 2005 2006 2007 2008 2009 2010 Free Cash Flow ($ 000) 1 Net Income 2 Plus: After-Tax Interest Expense 3 Unlevered Net Income 4 Plus: Depreciation 5 Less: Increases in NWC 6 Less: Capital Expenditures 7 Free Cash Flow of Fim 8 Plus: Net Borrowing 9 Less: After-Tax Interest Expense 5,193 6,247 6,960 8,382 10,545 4,420 4,420 4,420 5,083 5,304 9,613 10,667 11,380 13.465 15,849 5,450 5,405 6,865 7,678 7,710 3,412 3,663 4,089) 4,685) (5,231) 5,000 5,000 (20,000) 15,000) (8,000) 13,475 7409 (5,845 1,458 10,328 15,000 5,000 4,420 4,420 4,420) 5,083) 5,304 9,055 2,989 4,735 1,375 5,024 10 Free Cash Flow to Equity (Click on the Icon located on the top-right corner of the data table below in order to copy its contents into a spreadsheet) Ideko's Working Capital Requirements Working Capital Days Assets 2005 > 2005 Accounts Receivable Raw Materials Finished Goods Minimum Cash Balance Based on: Sales Revenue Raw Materials Costs Raw Materials Labor Costs Sales Revenue 60 30 45 30 30 Liabilities Wages Pavable Direct LaborAdmin Costs Raw Materials +Sales and Marketing 15 Other Accounts Payable Working Capital ($ 000) 2005 2006 2007 2008 2009 2010 Assets Accounts Receivable Raw Materials Finished Goods Minimum Cash Balance 23,070 2463 8.343 11,535 1,019 27,60431,403 35,609 40,264 45,411 18,44714,039 15,968 18,102 20,463 1,975 2,208 7,362 9,051 10,231 2,079 4,344 6,149 1,565 4.980 7,020 1,761 5,690 7,984 6.481 Total Current Assets Labilities Wages Payable 2,304 7.030 9,334 6,257 22,14025,038 28,267 31,974 36,077 4,103 2,019 6,271 ,7625,4646,365 7,342 8,290 1,618 1,810 3,451 ,7475,532 Other Accounts Payable Total Current Liabilities Net Working Capital Increase in Net Working Capital 4,057 4,117) 2,898 3,229 3,707 Forecast Ideko's free cash flow (reproduce Table 19.10assuming Ideko's market share wil increase by 0.65 percent per year, investment, financing, and depreciation wil be adjusted according y: and the proected improvements in woning capital oco at s lde os w n g cap a requirement ra h 2010 wil be as shown here ldeko's pro forma income statements for 2005-2010 are shown here, while its balance sheet for 2005 is shown here ldeko's production plant will require an expansion in 2010 when production volume will exceed the current level by 50% and the cos of tis ex anson wil be S 45 m lon. This amount will be borrowed from a financial institution at an interest rate of 6 7% The new projected capital investments are shown hreE!Assumo anincomo tax rate of 35% ) Calculate Ideko's free cash flow through 2010 below: (Round to the nearest $ 000) Free Cash Flow (5 000) Net Income 2006 Plus: After-tax Interest Expense Unlevered Net Income Plus Depreciation Less Increase in NWC Less Caplital Expenditures Free Cash Flow of Firm Plus Net Borrowing Less: After-tax Interest Expense Free Cash Flow to Equity Show transcribed image text