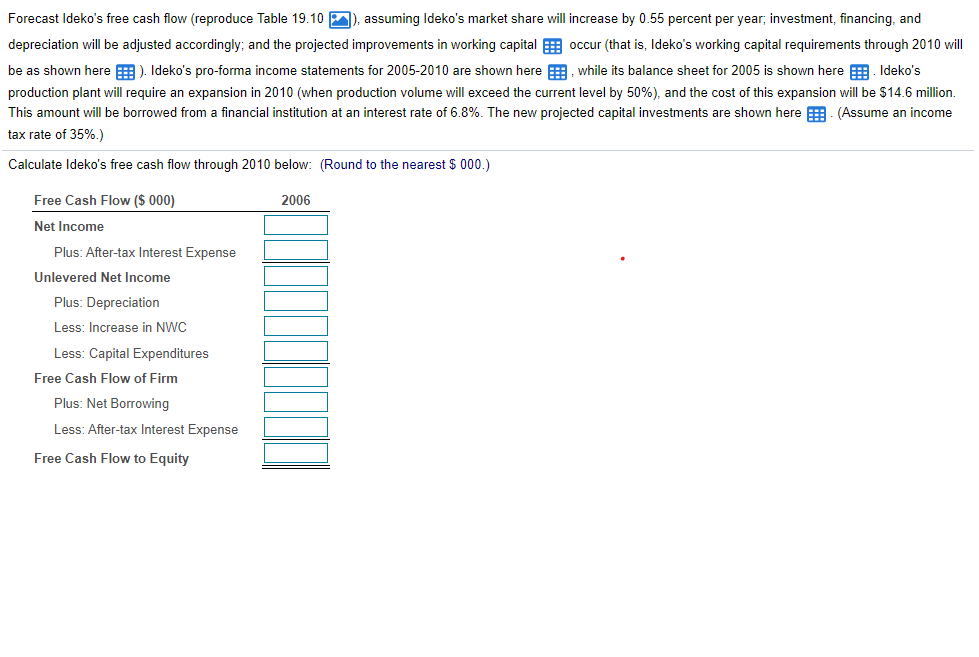
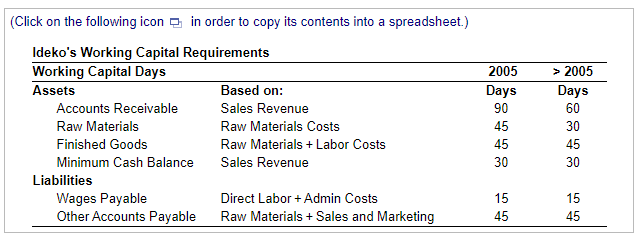
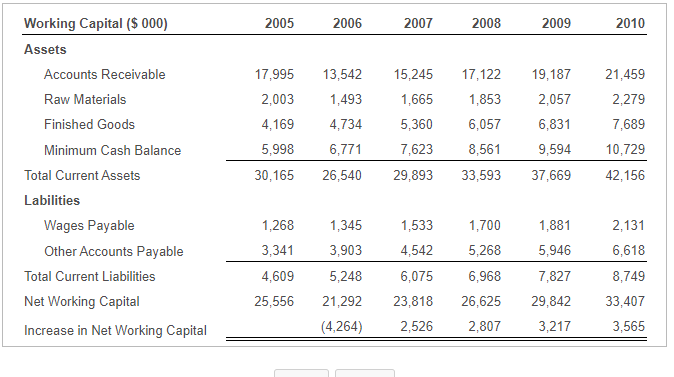
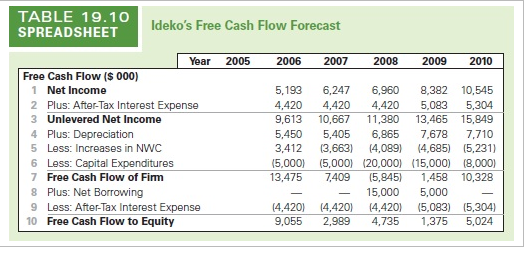
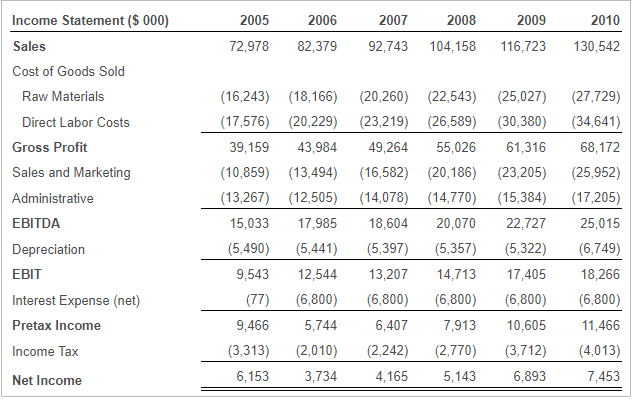
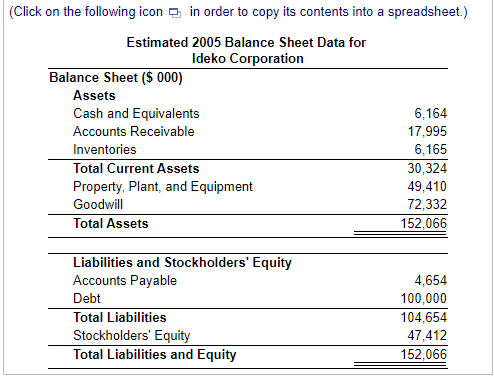
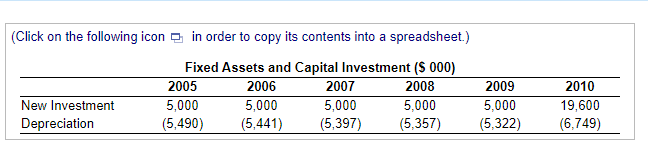
Forecast Ideko's free cash flow (reproduce Table 19.10), assuming Ideko's market share will increase by 0.55 percent per year; investment, financing, and depreciation will be adjusted accordingly; and the projected improvements in working capital E occur (that is, Ideko's working capital requirements through 2010 will be as shown here ). Ideko's pro-forma income statements for 2005-2010 are shown here , while its balance sheet for 2005 is shown here Ideko's production plant will require an expansion in 2010 (when production volume will exceed the current level by 50%), and the cost of this expansion will be $14.6 million. This amount will be borrowed from a financial institution at an interest rate of 6.8%. The new projected capital investments are shown here (Assume an income tax rate of 35%.) Calculate Ideko's free cash flow through 2010 below: (Round to the nearest $ 000.) Free Cash Flow ($ 000) 2006 Net Income Plus: After-tax Interest Expense Unlevered Net Income Plus: Depreciation Less: Increase in NWC Less: Capital Expenditures Free Cash Flow of Firm Plus: Net Borrowing Less: After-tax Interest Expense Free Cash Flow to Equity (Click on the following icon in order to copy its contents into a spreadsheet.) Ideko's Working Capital Requirements Working Capital Days Assets Based on: Accounts Receivable Sales Revenue Raw Materials Raw Materials Costs Finished Goods Raw Materials + Labor Costs Minimum Cash Balance Sales Revenue Liabilities Wages Payable Direct Labor + Admin Costs Other Accounts Payable Raw Materials + Sales and Marketing 2005 Days 90 45 45 30 > 2005 Days 60 30 45 30 15 45 15 45 2005 2006 2007 2008 2009 2010 Working Capital ($ 000) Assets Accounts Receivable Raw Materials Finished Goods Minimum Cash Balance Total Current Assets Labilities Wages Payable Other Accounts Payable Total Current Liabilities Net Working Capital Increase in Net Working Capital 17,995 2,003 4,169 5,998 30,165 13,542 1,493 4,734 6,771 26,540 15,245 1,665 5,360 7,623 29,893 17,122 1,853 6,057 8,561 33,593 19,187 2,057 6,831 9,594 37,669 21,459 2,279 7,689 10,729 42,156 1,268 1,345 1,533 4,542 1,881 5,946 3,903 1,700 5,268 6,968 3,341 4,609 25,556 2,131 6,618 8,749 33,407 5,248 6,075 7,827 21,292 23,818 26,625 29,842 3,217 (4,264) 2,526 2,807 3,565 TABLE 19.10 SPREADSHEET Ideko's Free Cash Flow Forecast Year 2005 2006 2007 2008 2009 2010 Free Cash Flow ($ 000) 1 Net Income 5,193 6,247 6.960 8,382 10,545 2 Plus: After-Tax Interest Expense 4,420 4,420 4,420 5,083 5,304 3 Unlevered Net Income 9,613 10,667 11,380 13,465 15,849 4 Plus: Depreciation 5,450 5,405 6,865 7,678 7.710 5 Less: Increases in NWC 3,412 (3,663) (4,089) 14,685) (5,231) 6 Less: Capital Expenditures (5,000) (5,000) (20,000) (15,000) (8,000) 7 Free Cash Flow of Firm 13,475 7,409 (5.845) 1,458 10,328 8 Plus: Net Borrowing 15,000 5,000 9 Less: After-Tax Interest Expense (4,420) (4,420) (4,420) (5,083) (5,304) 10 Free Cash Flow to Equity 9,055 2,989 4,735 1,375 5,024 2005 72,978 2006 82,379 2007 2008 92,743 104,158 2009 116,723 2010 130,542 Income Statement ($ 000) Sales Cost of Goods Sold Raw Materials Direct Labor Costs Gross Profit Sales and Marketing Administrative EBITDA Depreciation EBIT Interest Expense (net) Pretax Income Income Tax (16,243) (18,166) (20,260) (22,543) (17,576) (20,229) (23,219) (26,589) 39,159 43,984 49,264 55,026 (10,859) (13,494) (16,582) (20,186) (13,267) (12,505) (14,078) (14,770) 15,033 17,985 18,604 20,070 (5,490) (5,441) (5,397) (5,357) 9,543 12,544 13,207 14,713 (77) (6,800) (6,800) (6,800) 9,466 5,744 6,407 7,913 (3,313) (2,010) (2,242) (2,770) 6,153 3,734 4,165 5,143 (25,027) (30,380) 61,316 (23,205) (15,384) 22,727 (5,322) 17,405 (6,800) 10,605 (3,712) 6,893 (27,729) (34,641) 68,172 (25,952) (17,205) 25,015 (6,749) 18,266 (6,800) 11,466 (4,013) 7,453 Net Income (Click on the following icon 9. in order to copy its contents into a spreadsheet.) Estimated 2005 Balance Sheet Data for Ideko Corporation Balance Sheet ($ 000) Assets Cash and Equivalents 6,164 Accounts Receivable 17,995 Inventories 6,165 Total Current Assets 30,324 Property, Plant, and Equipment 49,410 Goodwill 72,332 Total Assets 152,066 Liabilities and Stockholders' Equity Accounts Payable Debt Total Liabilities Stockholders' Equity Total Liabilities and Equity 4,654 100,000 104,654 47,412 152,066 (Click on the following icon in order to copy its contents into a spreadsheet.) Fixed Assets and Capital Investment (8 000) 2005 2006 2007 2008 5,000 5,000 5,000 5,000 (5,490) (5,441) (5,397) (5,357) New Investment Depreciation 2009 5,000 (5,322) 2010 19,600 (6,749) Forecast Ideko's free cash flow (reproduce Table 19.10), assuming Ideko's market share will increase by 0.55 percent per year; investment, financing, and depreciation will be adjusted accordingly; and the projected improvements in working capital E occur (that is, Ideko's working capital requirements through 2010 will be as shown here ). Ideko's pro-forma income statements for 2005-2010 are shown here , while its balance sheet for 2005 is shown here Ideko's production plant will require an expansion in 2010 (when production volume will exceed the current level by 50%), and the cost of this expansion will be $14.6 million. This amount will be borrowed from a financial institution at an interest rate of 6.8%. The new projected capital investments are shown here (Assume an income tax rate of 35%.) Calculate Ideko's free cash flow through 2010 below: (Round to the nearest $ 000.) Free Cash Flow ($ 000) 2006 Net Income Plus: After-tax Interest Expense Unlevered Net Income Plus: Depreciation Less: Increase in NWC Less: Capital Expenditures Free Cash Flow of Firm Plus: Net Borrowing Less: After-tax Interest Expense Free Cash Flow to Equity (Click on the following icon in order to copy its contents into a spreadsheet.) Ideko's Working Capital Requirements Working Capital Days Assets Based on: Accounts Receivable Sales Revenue Raw Materials Raw Materials Costs Finished Goods Raw Materials + Labor Costs Minimum Cash Balance Sales Revenue Liabilities Wages Payable Direct Labor + Admin Costs Other Accounts Payable Raw Materials + Sales and Marketing 2005 Days 90 45 45 30 > 2005 Days 60 30 45 30 15 45 15 45 2005 2006 2007 2008 2009 2010 Working Capital ($ 000) Assets Accounts Receivable Raw Materials Finished Goods Minimum Cash Balance Total Current Assets Labilities Wages Payable Other Accounts Payable Total Current Liabilities Net Working Capital Increase in Net Working Capital 17,995 2,003 4,169 5,998 30,165 13,542 1,493 4,734 6,771 26,540 15,245 1,665 5,360 7,623 29,893 17,122 1,853 6,057 8,561 33,593 19,187 2,057 6,831 9,594 37,669 21,459 2,279 7,689 10,729 42,156 1,268 1,345 1,533 4,542 1,881 5,946 3,903 1,700 5,268 6,968 3,341 4,609 25,556 2,131 6,618 8,749 33,407 5,248 6,075 7,827 21,292 23,818 26,625 29,842 3,217 (4,264) 2,526 2,807 3,565 TABLE 19.10 SPREADSHEET Ideko's Free Cash Flow Forecast Year 2005 2006 2007 2008 2009 2010 Free Cash Flow ($ 000) 1 Net Income 5,193 6,247 6.960 8,382 10,545 2 Plus: After-Tax Interest Expense 4,420 4,420 4,420 5,083 5,304 3 Unlevered Net Income 9,613 10,667 11,380 13,465 15,849 4 Plus: Depreciation 5,450 5,405 6,865 7,678 7.710 5 Less: Increases in NWC 3,412 (3,663) (4,089) 14,685) (5,231) 6 Less: Capital Expenditures (5,000) (5,000) (20,000) (15,000) (8,000) 7 Free Cash Flow of Firm 13,475 7,409 (5.845) 1,458 10,328 8 Plus: Net Borrowing 15,000 5,000 9 Less: After-Tax Interest Expense (4,420) (4,420) (4,420) (5,083) (5,304) 10 Free Cash Flow to Equity 9,055 2,989 4,735 1,375 5,024 2005 72,978 2006 82,379 2007 2008 92,743 104,158 2009 116,723 2010 130,542 Income Statement ($ 000) Sales Cost of Goods Sold Raw Materials Direct Labor Costs Gross Profit Sales and Marketing Administrative EBITDA Depreciation EBIT Interest Expense (net) Pretax Income Income Tax (16,243) (18,166) (20,260) (22,543) (17,576) (20,229) (23,219) (26,589) 39,159 43,984 49,264 55,026 (10,859) (13,494) (16,582) (20,186) (13,267) (12,505) (14,078) (14,770) 15,033 17,985 18,604 20,070 (5,490) (5,441) (5,397) (5,357) 9,543 12,544 13,207 14,713 (77) (6,800) (6,800) (6,800) 9,466 5,744 6,407 7,913 (3,313) (2,010) (2,242) (2,770) 6,153 3,734 4,165 5,143 (25,027) (30,380) 61,316 (23,205) (15,384) 22,727 (5,322) 17,405 (6,800) 10,605 (3,712) 6,893 (27,729) (34,641) 68,172 (25,952) (17,205) 25,015 (6,749) 18,266 (6,800) 11,466 (4,013) 7,453 Net Income (Click on the following icon 9. in order to copy its contents into a spreadsheet.) Estimated 2005 Balance Sheet Data for Ideko Corporation Balance Sheet ($ 000) Assets Cash and Equivalents 6,164 Accounts Receivable 17,995 Inventories 6,165 Total Current Assets 30,324 Property, Plant, and Equipment 49,410 Goodwill 72,332 Total Assets 152,066 Liabilities and Stockholders' Equity Accounts Payable Debt Total Liabilities Stockholders' Equity Total Liabilities and Equity 4,654 100,000 104,654 47,412 152,066 (Click on the following icon in order to copy its contents into a spreadsheet.) Fixed Assets and Capital Investment (8 000) 2005 2006 2007 2008 5,000 5,000 5,000 5,000 (5,490) (5,441) (5,397) (5,357) New Investment Depreciation 2009 5,000 (5,322) 2010 19,600 (6,749)