Answered step by step
Verified Expert Solution
Question
1 Approved Answer
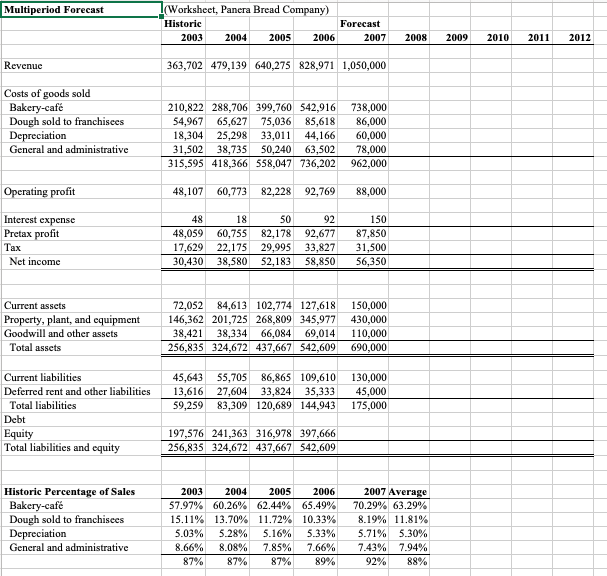
Forecast Revenue correctly based on this? Multiperiod Forecast Revenue Costs of goods sold Bakery-caf Dough sold to franchisees Depreciation General and administrative Operating profit Interest
Forecast Revenue correctly based on this?

Multiperiod Forecast Revenue Costs of goods sold Bakery-caf Dough sold to franchisees Depreciation General and administrative Operating profit Interest expense Pretax profit Tax Net income Current assets Property, plant, and equipment Goodwill and other assets Total assets Current liabilities Deferred rent and other liabilities Total liabilities Debt Equity Total liabilities and equity Historic Percentage of Sales Bakery-caf Dough sold to franchisees Depreciation General and administrative (Worksheet, Panera Bread Company) Historic 2003 2004 2005 2006 363,702 479,139 640,275 828,971 1,050,000 48,107 60,773 82,228 92,769 86,000 210,822 288,706 399,760 542,916 738,000 54,967 65,627 75,036 85,618 18,304 25,298 33,011 44,166 31,502 38,735 50,240 63,502 315,595 418,366 558,047 736,202 18 50 92 48 48,059 60,755 82,178 92,677 17,629 22,175 29,995 33,827 30,430 38,580 52,183 58,850 Forecast 45,643 55,705 86,865 109,610 13,616 27,604 33,824 35,333 59,259 83,309 120,689 144,943 2007 197,576 241,363 316,978 397,666 256,835 324,672 437,667 542,609 2003 2004 2005 2006 57.97% 60.26 % 62.44% 65.49% 15.11% 13.70% 11.72% 10.33% 5.03% 5.28% 5.16% 5.33% 8.66% 8.08% 7.85% 7.66% 87% 87% 87% 89% 60,000 78,000 962,000 72,052 84,613 102,774 127,618 150,000 146,362 201,725 268,809 345,977 430,000 38,421 38,334 66,084 69,014 110,000 256,835 324,672 437,667 542,609 690,000 88,000 150 87,850 31,500 56,350 130,000 45,000 175,000 2008 2009 2010 2011 2012 2007 Average 70.29% 63.29% 8.19% 11.81% 5.71% 5.30% 7.43% 7.94% 92% 88%
Step by Step Solution
★★★★★
3.41 Rating (157 Votes )
There are 3 Steps involved in it
Step: 1
To forecast revenue for the years 20072012 we can use the average historic percentage of sales for t...
Get Instant Access to Expert-Tailored Solutions
See step-by-step solutions with expert insights and AI powered tools for academic success
Step: 2

Step: 3

Ace Your Homework with AI
Get the answers you need in no time with our AI-driven, step-by-step assistance
Get Started


