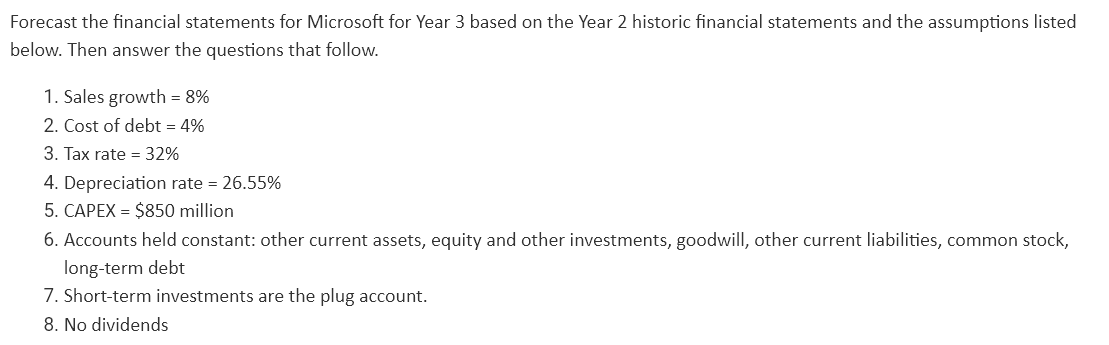
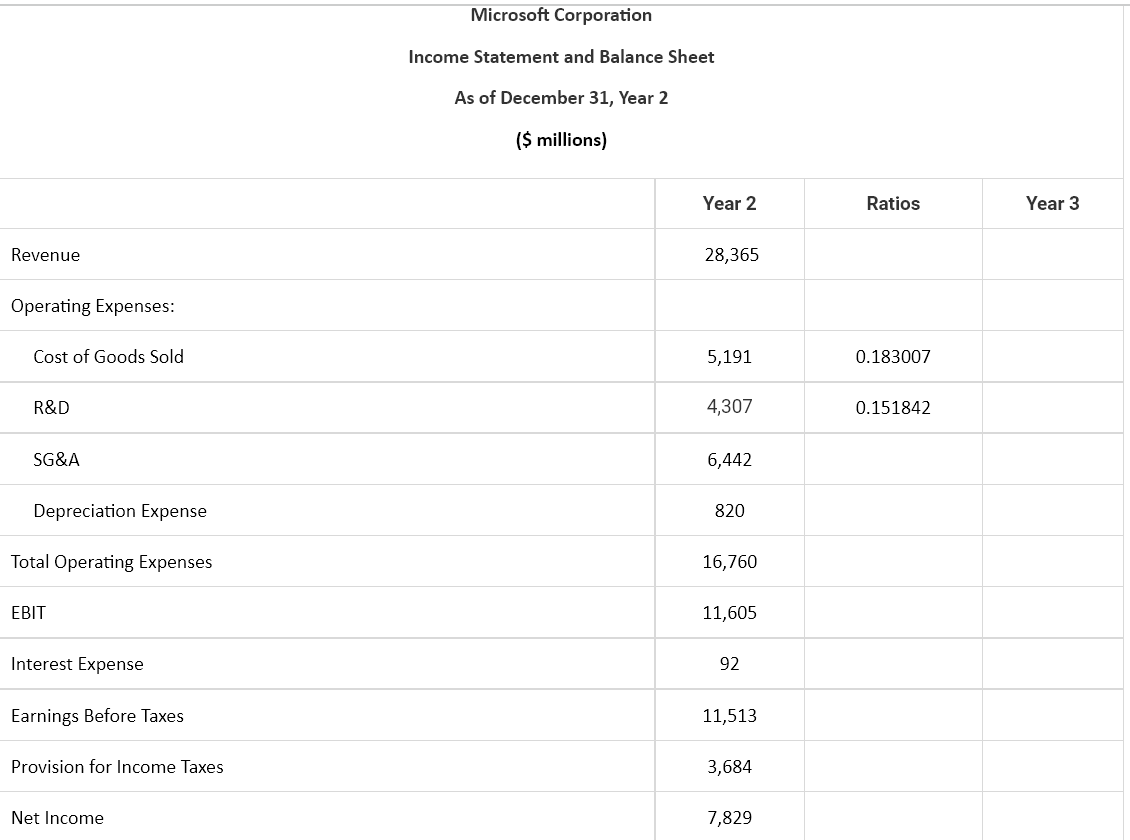
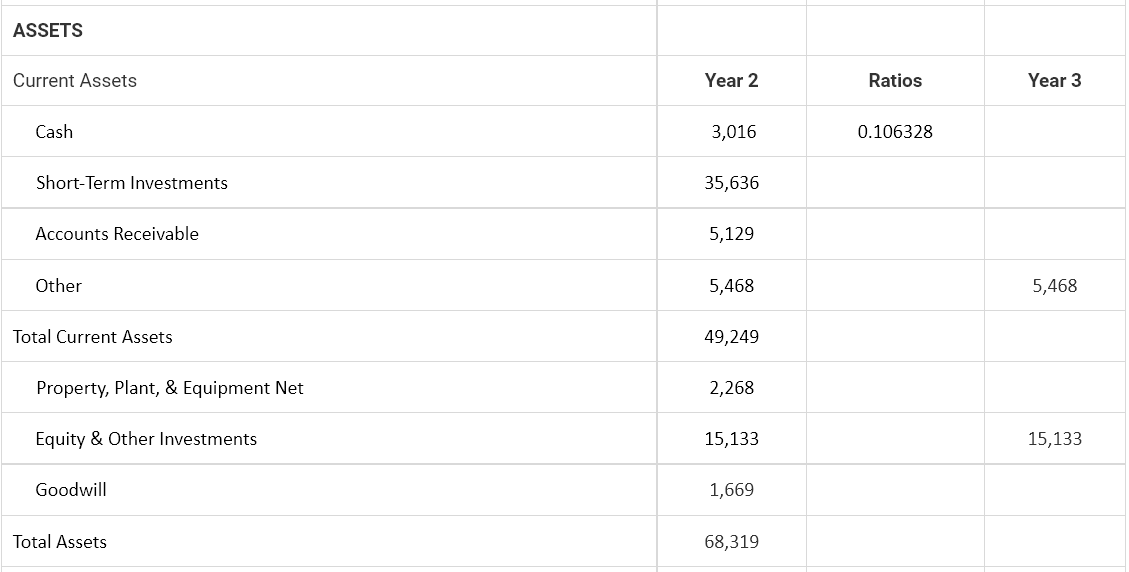
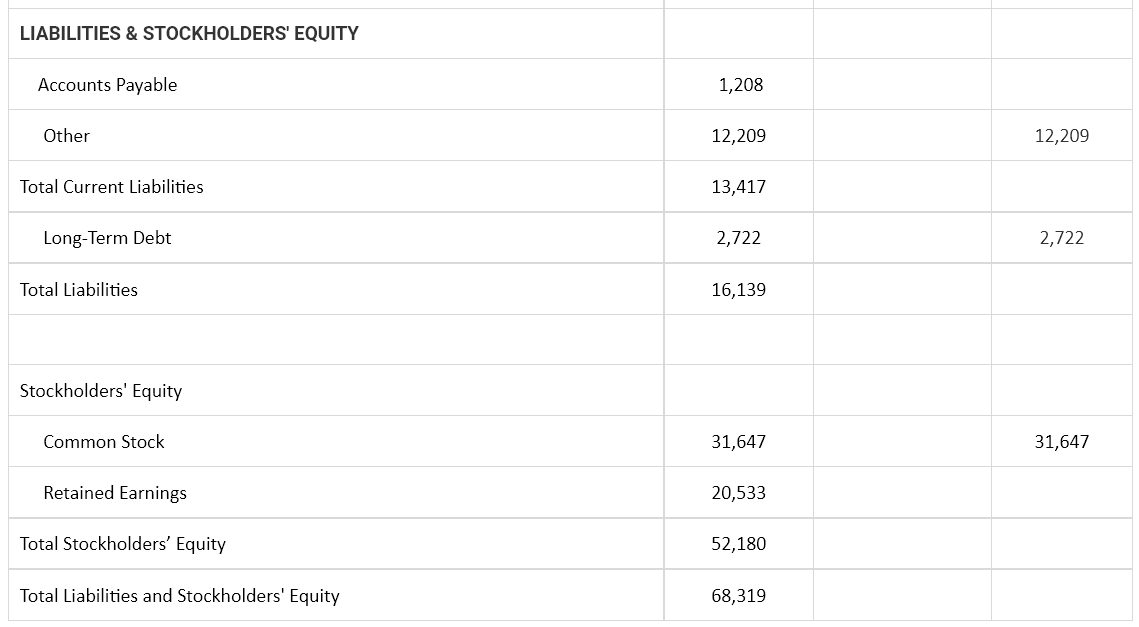
Forecast the financial statements for Microsoft for Year 3 based on the Year 2 historic financial statements and the assumptions listed below. Then answer the questions that follow. 1. Sales growth = 8% 2. Cost of debt = 4% 3. Tax rate = 32% 4. Depreciation rate = 26.55% 5. CAPEX = $850 million 6. Accounts held constant: other current assets, equity and other investments, goodwill, other current liabilities, common stock, long-term debt 7. Short-term investments are the plug account. 8. No dividends Revenue Operating Expenses: Cost of Goods Sold R&D SG&A Depreciation Expense Total Operating Expenses EBIT Interest Expense Earnings Before Taxes Provision for Income Taxes Net Income Microsoft Corporation Income Statement and Balance Sheet As of December 31, Year 2 ($ millions) Year 2 28,365 5,191 4,307 6,442 820 16,760 11,605 92 11,513 3,684 7,829 Ratios 0.183007 0.151842 Year 3 ASSETS Current Assets Cash Short-Term Investments Accounts Receivable Other Total Current Assets Property, Plant, & Equipment Net Equity & Other Investments Goodwill Total Assets Year 2 3,016 35,636 5,129 5,468 49,249 2,268 15,133 1,669 68,319 Ratios 0.106328 Year 3 5,468 15,133 LIABILITIES & STOCKHOLDERS' EQUITY Accounts Payable Other Total Current Liabilities Long-Term Debt Total Liabilities Stockholders' Equity Common Stock Retained Earnings Total Stockholders' Equity Total Liabilities and Stockholders' Equity 1,208 12,209 13,417 2,722 16,139 31,647 20,533 52,180 68,319 12,209 2,722 31,647 What are short-term investments for Year 3? O $44,750 O $45,216 O $46,804 O $43,547 Forecast the financial statements for Microsoft for Year 3 based on the Year 2 historic financial statements and the assumptions listed below. Then answer the questions that follow. 1. Sales growth = 8% 2. Cost of debt = 4% 3. Tax rate = 32% 4. Depreciation rate = 26.55% 5. CAPEX = $850 million 6. Accounts held constant: other current assets, equity and other investments, goodwill, other current liabilities, common stock, long-term debt 7. Short-term investments are the plug account. 8. No dividends Revenue Operating Expenses: Cost of Goods Sold R&D SG&A Depreciation Expense Total Operating Expenses EBIT Interest Expense Earnings Before Taxes Provision for Income Taxes Net Income Microsoft Corporation Income Statement and Balance Sheet As of December 31, Year 2 ($ millions) Year 2 28,365 5,191 4,307 6,442 820 16,760 11,605 92 11,513 3,684 7,829 Ratios 0.183007 0.151842 Year 3 ASSETS Current Assets Cash Short-Term Investments Accounts Receivable Other Total Current Assets Property, Plant, & Equipment Net Equity & Other Investments Goodwill Total Assets Year 2 3,016 35,636 5,129 5,468 49,249 2,268 15,133 1,669 68,319 Ratios 0.106328 Year 3 5,468 15,133 LIABILITIES & STOCKHOLDERS' EQUITY Accounts Payable Other Total Current Liabilities Long-Term Debt Total Liabilities Stockholders' Equity Common Stock Retained Earnings Total Stockholders' Equity Total Liabilities and Stockholders' Equity 1,208 12,209 13,417 2,722 16,139 31,647 20,533 52,180 68,319 12,209 2,722 31,647 What are short-term investments for Year 3? O $44,750 O $45,216 O $46,804 O $43,547